Practical ocean literacy for all: Earth science Teach article
Author(s): Giulia Realdon
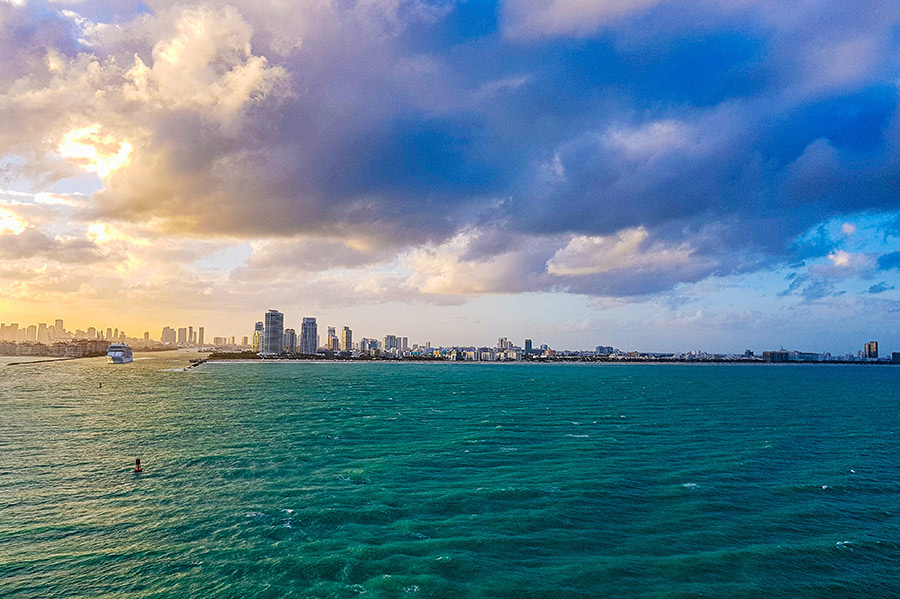
Wherever we live, we affect and are affected by the ocean. Track down escaped rubber ducks, raise mountains, and feel the Sun’s heat to learn more.
Image courtesy of Rosaria Cercola
Since the early 2000s, a global movement for ocean literacy (OL) has been spreading. OL means an understanding of the ocean’s influence on you and your influence on the ocean.[1] So, why should a Swiss master chocolatier, for example, care about the ocean? Wherever you live, you enjoy countless ecosystem services provided by the ocean. Going back to the master chocolatier in a land-locked country:
The climate and weather of a region are driven by the transport of water and energy operated by the ocean
The same applies for the provision of freshwater (and the supply of renewable energy, as hydroelectric and wind)
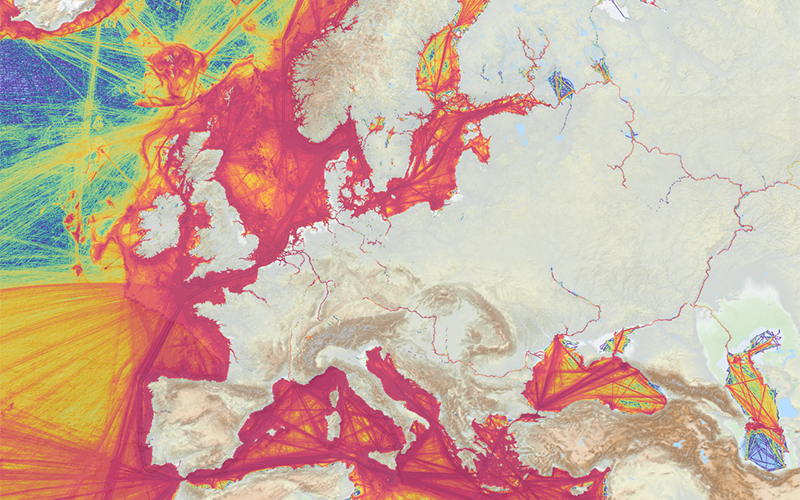
Raw materials used by the chocolatier (similarly to about 80% of goods we all use) are transported across the ocean by ships
Orders sent and received by the chocolatier through the internet travel via submarine cables.
Moreover, the chocolatier’s lifestyle affects the ocean in many ways, for example, through CO2 production and its consequences: global warming, ocean acidification, sea level rises, etc.
The ocean literacy principles
The activities are organized following the seven OL principles,[1] which are the ABCs of the sea:
Earth has one big ocean with many features.
The ocean and life in the ocean shape the features of Earth.
The ocean is a major influence on weather and climate.
The ocean makes Earth habitable.
The ocean supports a great diversity of life and ecosystems.
The ocean and humans are inextricably interconnected.
The ocean is largely unexplored.
If you live in a coastal area, you can provide your students with teaching activities on the seashore, but what if you live far from the coast? No problem, you can bring the ocean into your classroom through the following cheap and simple classroom activities.
In this article, the first three OL principles are addressed.
Activity 1: One ocean
OL principle 1 – the Earth has one big ocean with many features
This means that, despite the different names, there is only one water mass connected by ocean currents. You can address this topic with the activity lost at sea[2] based on the real case of nearly 29 000 rubber ducks being spilled into the Pacific Ocean from a ship in 1992, which were then used by oceanographers to study ocean currents. The toys, named Friendly Floatees, began to wash up on the coasts of many countries along the Pacific Ocean and, in the following 15 years, along the Atlantic coast of the USA and Scotland, and they were even found in the English Channel. This activity takes about 50 minutes.
Tell students the story of the container ship Ever Laurel heading to Tacoma, Washington, which, after leaving Hong Kong harbour, encountered a severe storm. One of its shipping containers, full of rubber toys, fell overboard and nearly 29 000 floating toys spilled into the ocean.
Give students the location of the first two steps of the ship’s journey:
Hong Kong harbour, early January 1992, latitude 21oN, longitude 110oE (start);
North Pacific Ocean, 10 January 1992, latitude 45oN, longitude 178oE (toy container lost at sea).
Using the printed world map, ask the students to mark the two locations and add the date. Then ask them to predict the possible route of the floating toys.
Ask the students the following questions. Are they likely to stay in the North Pacific Ocean? Could they move to the South Pacific Ocean or to other ocean basins?
Give the students the table showing the locations of the Friendly Floatees found and ask them to mark them on the map in chronological (time) order.
Show students a map of ocean surface currents and ask them to draw the likely routes of the toys, taking into account the directions of the ocean currents, and mark them on the map in chronological order.
Ask the students to mark the new locations on the map in chronological order.
Ask them to imagine how the Friendly Floatees could have reached the Atlantic Ocean. How could the toys have moved through the frozen Arctic?
Discussion
By taking advantage of a real case involving familiar toys, you can help your students visualize the Global Conveyor Belt, a (sea) current loop set in motion mainly by differences in water density (due to temperature and salinity) and by the action of winds. These ocean currents redistribute matter (including pollution) and energy (heat) in every part of the ocean: a drop of seawater literally travels around the world in 1000 years.
Activity 2: The ocean shapes the Earth
OL principle 2 – the ocean and life in the ocean shape the features of Earth
Most people are unaware that many of the familiar landscapes, such as mountains and hills, originally formed in the ocean as sedimentary rocks, which also produce soil through erosion and transportation. A simple modelling activity, the Himalayas in 30 seconds,[3] allows this million-years-long process to be visualized. This activity takes about 15 minutes.
Left: North Face of Everest toward base camp. Right: Model of rocks, from the seafloor to mountains. Images: Left: shrimpo1967/Flickr, CC BY-SA 2.0. Right: Giulia Realdon, CC BY-NC.
Materials
Small transparent plastic box, e.g., a chocolate box or rectangular plastic container
Piece of board to fit snugly into the box
Dry sand
Flour, or any powder of contrasting colour to that of the sand
Spoons for adding sand and flour to the box
Picture of a marine fossil, like an ammonite, or a mollusc shell
Procedure
Show students the fossil picture. This organism lived and died in the sea, yet one like it was found in rocks high in a mountain range, like the Himalayas or the Alps. Ask the students how this could happen.
Explain that these mountains were formed when two lithospheric plates collided due to tectonic processes. We are going to imitate the formation and uplift of the layers of rock on the seafloor before and during the collision of the plates.
Tell the students that the box represents an ancient seafloor near a coast where a river deposited sediment-containing water; normally, they were fine sediments (the flour) but sometimes also coarser sediments (the sand), for example, in the case of floods.
Ask a student to build up several flat layers of sand and flour in the box, with a piece of board standing in one end. You can add some small shells, which represent fossils. Do not fill the box more than half full.
Ask another student to carefully push the board across the box, so that it begins to compress the sand and flour layers.
Usually, the layers buckle up into a fold; eventually, one set of layers slides over the rest, producing a fault.
The upper surface of the sand rises to the top of the box, imitating the rise of the layers of rock to form mountains, where fossils of marine organisms can be found.
Discussion
You can use this experience to introduce the topic of plate tectonics; in fact, mountain building (orogenesis) is linked to the convergent movement of lithospheric plates.
Another possible extension consists of having students perform an internet search to look for examples of marine sedimentary rocks (e.g., limestone or chalk) in the hills/mountains of their region. In the case of flat areas, they can explore the soil of their region: many soils originate from marine sedimentary rocks, like the chalky soil in south-eastern UK and the Mediterranean “terra rossa” famous for vineyards.
The lithosphere
The lithosphere is the solid outer part of the Earth, including the crust and the brittle upper portion of the mantle. The lithosphere is divided into about a dozen major plates (plus some smaller ones) below the continents and ocean. The plates move over a ductile layer of the mantle called the asthenosphere at a speed of 1.8–20 cm per year (similar to nail or hair growth). The plate boundary types – convergent, divergent, or transform (moving horizontally past) – describe how the plates move relative to each other.
The convergent movement of plates leads to the building of a mountain range when at least one of the plates carries a continental mass. The plate margins collide and the continental lithosphere, which also contains marginal areas of marine layers, folds, creates faults, and rises in height.
These convergent areas are also characterized by earthquakes and, if one of the plates is made of oceanic lithosphere, by volcanic activity. Volcanism is due to the subduction (sinking) of the dense oceanic lithosphere into the mantle along the contact zone of the convergent plates and to the melting of the rocks above it, resulting in magma, which rises through the crust.
OL principle 3 – the ocean is a major influence on weather and climate
Since the beginning of mass tourism, seaside resorts have been popular destinations due to their mild climate in all seasons. The Mediterranean coast alone attracts about 30% of the world’s tourists. Let’s explore the influence of the ocean on weather and climate by means of a simple model of sea and land made with household materials. This activity requires 15 minutes to prepare the equipment in advance and about 1 hour to run the activity (4×5 minutes for the temperature measurements; the rest for questions and comments).
Equipment for testing the different heat capacities of water and soil Image: Giulia Realdon, CC BY-NC 2.0
Materials
Two plastic soft drink bottles with the upper third cut off in advance (by the teacher with a pair of scissors)
Two digital thermometers
Tap water
Soil
Fridge
Pen and paper to record the temperature in the two containers
If the activity is done in winter, a desk lamp with a powerful light bulb
Kitchen scales (for older students)
Procedure
Fill two thirds of the first container with water and the second container with soil.
For older students, more precise measurements can be obtained by filling the two containers with the same weights of water and soil.
Insert a thermometer into each container and tape it to the posterior side (with respect to the side that will be exposed to sunlight).
Leave the two containers in the same place overnight (e.g., outside in a shaded place, except in summer, when a fridge is more suitable), so that they are at the same temperature at the beginning of the activity.
Ask the students to read and record the temperature in both containers and then expose the two containers to direct sunlight for 15 minutes.
In winter, you can use a desk lamp instead of sunlight. In this case, keep the students at a safe distance from the lamp and remove the lamp before reading the temperature.
Ask the students if the containers will reach the same temperature or not.
Ask the students to record the temperature in the two containers.
Wait other 15 minutes and take a second temperature measurement.
Put both containers in the fridge and ask the students to record the temperatures after 20 and 40 minutes.
Which container heated/cooled the fastest? Which one more slowly?
Finally, ask the students to correlate what they have observed in the lab with what happens in the real world. Can you link the observed phenomenon to the climates of coastal and landlocked regions? Why are coastal regions cooler in summer and warmer in winter? What is the role of the sea?
Discussion
Students can deepen their understanding of the topic by studying real cases: the temperature of towns located at the same latitude but close to or far from the sea (e.g., Amsterdam and Berlin, Copenhagen and Moscow, or another couple in your country). You can find these data (minimum/maximum temperature per day, week, a whole year) on a weather-forecasting website with an archive section, such as https://www.woeurope.eu/.
Summary
Through these activities, we have explored some of the physical aspects of the ocean, but there is much more to discover by means of practical activities with your students, for instance, the role of the ocean in atmospheric oxygen production, ocean biodiversity and ecosystems, the human–ocean interaction, and ocean exploration. Don’t miss the second part of our journey through the OL principles in a later issue of Science in School.
Acknowledgements
The first two activities are based on activity worksheets from Earthlearningidea.[1,2]
Find out about the physics at work beneath the waves with these classroom experiments: Watt S (2012) Movers and shakers: physics in the oceans. Science in School25: 28–33.
Learn about the role of the oceans in climate change: Harrison T, Khan A, Shallcross D (2017) Climate change: why the oceans matter. Science in School39: 12–15.
Author(s)
Giulia Realdon, PhD in Earth sciences education, is a biologist, retired natural sciences teacher, an education researcher at the University of Camerino, a non-formal educator, and a teacher trainer. Giulia is Scientix ambassador, member of the Italian Steering Committee of Science on Stage, and European Geoscience Union (EGU) education field officer for Italy.