The European Atlas of the Seas: an interactive tool for ocean literacy Inspire article
Looking for a user-friendly interactive map-based educational tool on the ocean? Dive into the European Atlas of the Seas!
Introduction
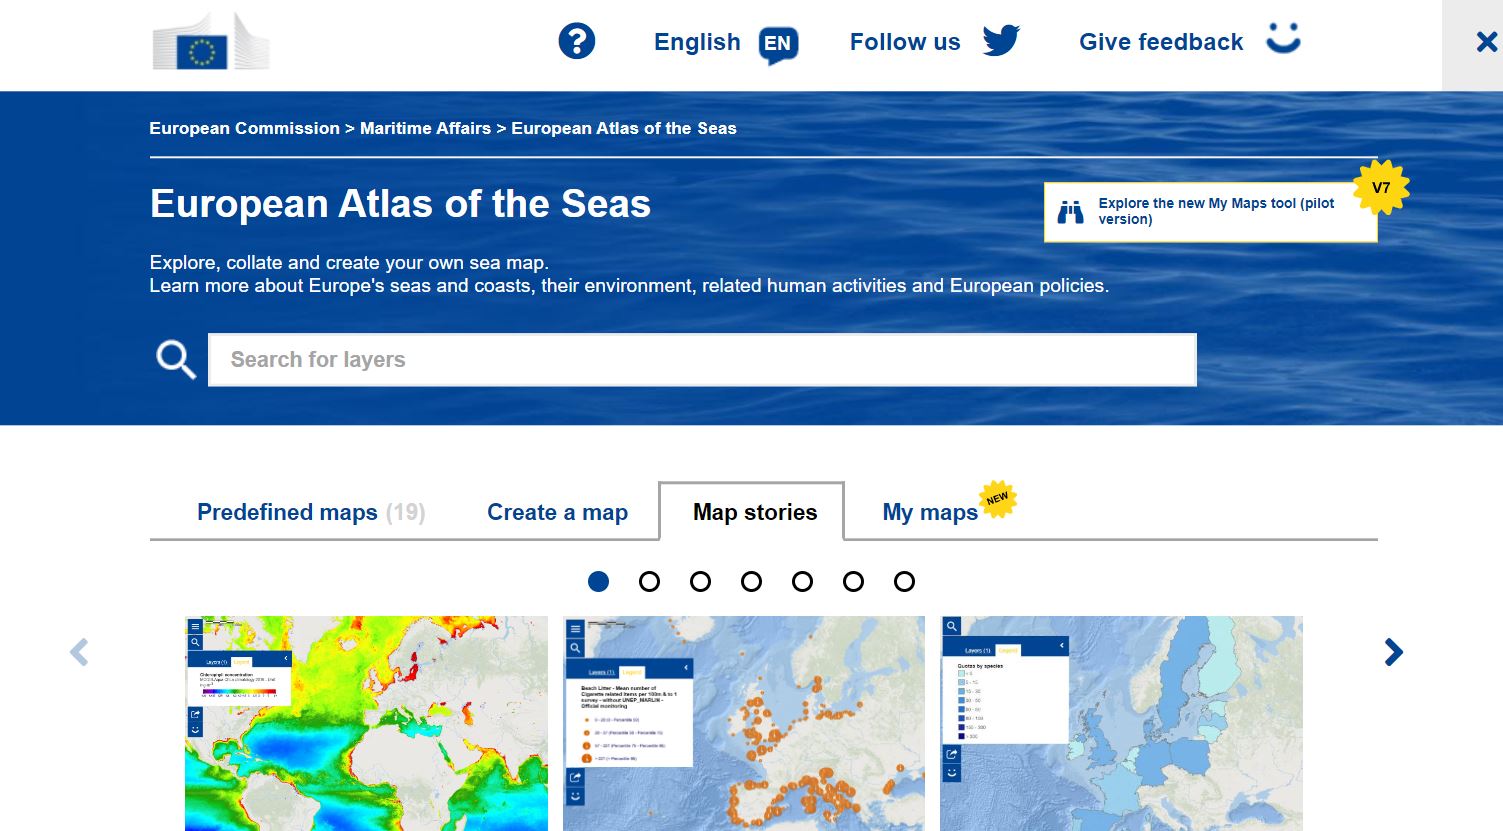
To understand what we can do better to protect the health of the ocean, it is essential that we learn how the ocean influences us and how we influence the ocean. This is referred to as ‘ocean literacy’.[1] To achieve an ocean-literate society, we need to communicate marine data and information in an attractive, easy-to-digest, and playful way. This is the objective of the European Atlas of the Seas, a freely accessible, web‐based, interactive tool, available in 24 languages, which delivers a wide variety of map layers derived from data on natural (e.g., coastal geology, mean underwater depth, submarine volcanoes) and socio‐economic (e.g., fisheries and aquaculture, transports, tourism) features in the marine and coastal regions of Europe. The European Atlas of the Seas is an initiative of the Directorate-General for Maritime Affairs and Fisheries (DG MARE)of the European Commission. It is managed by the European Marine Observation and Data Network (EMODnet)Secretariat.
© European Union
A constantly evolving catalogue of interactive map layers
The European Atlas of the Seas is composed of map layers. Map layers are used to view geographic data on selected topics, with each map layer displaying a specific set of data. Thanks to its catalogue of more than 275 map layers, the European Atlas of the Seas makes it possible for teachers, students, and citizens from all around Europe to explore a wide range of popular marine topics, such as the environment, marine life, nature conservation, sea surface temperature trends, sea level rise, marine litter, fisheries, aquaculture, tourism, energy, transport, and much more! Map layers are regularly updated with new data and new map layers are also added.
Users of the Atlas can choose to view one map layer at a time or to select a combination of two to three map layers to create their own map based on information they are looking for. For example, by combining map layers from Argo floats (free-drifting profiling floats that collect environmental ocean data) and underwater gliders (instruments that follow an up-and-down, sawtooth-like profile through the water and automatically collect ocean data), it is possible to view data from different oceanographic instruments deployed at sea at the same time.
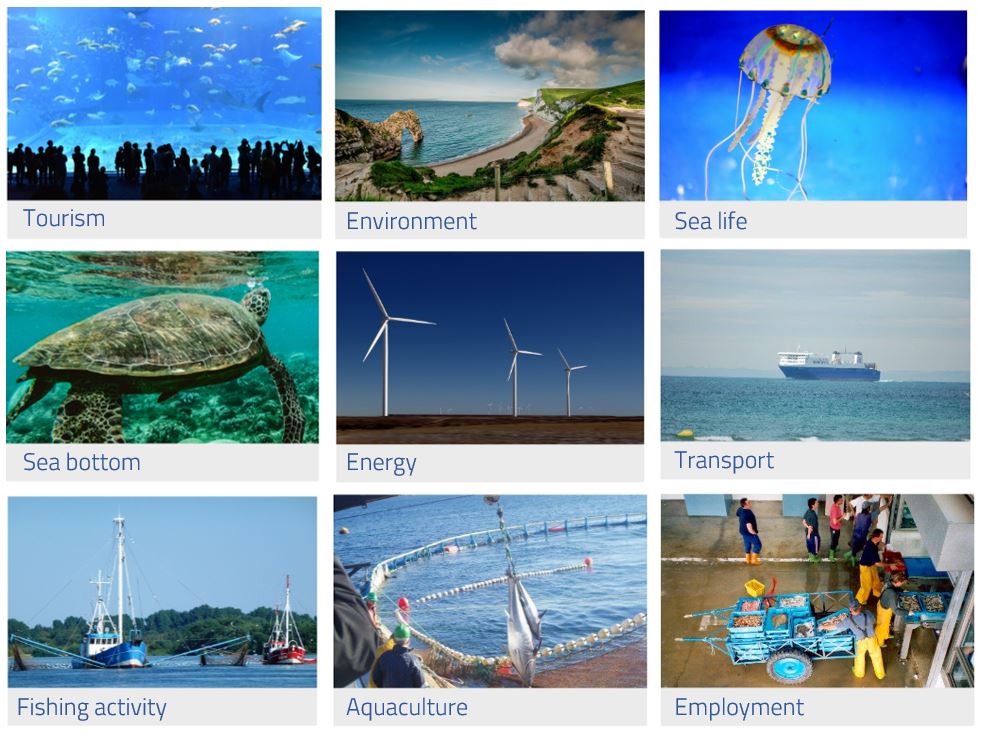
It is also possible to look at predefined maps created by the Atlas team, with combinations of map layers that address topics like sea life, aquaculture, or transport.
© European Union
For each map layer, a description is provided with further details on its content and indication of who the data provider is. This allows teachers and students to clearly identify the source of the data and obtain more information on the data if they wish. A total of 18 data providers contribute data to the Atlas, including the European Commission, EMODnet, the European Environmental Agency (EEA), Eurostat, the Joint Research Center (JRC), the Copernicus Marine Service,the Network of European Blue Schools, the Youth4Ocean Forum, and the EU4Ocean Platform.
A Map of the Week is published weekly on the European Commission’s Maritime Forum, highlighting an interesting map layer in the light of recent news related to the ocean, a past or upcoming event, or a policy development. Follow the Atlas on Twitter at @EuropeAtlasSeas to stay informed!
Useful functionalities
The interactive nature of the Atlas provides a number of functionalities, including:
- searching for map layers;
- adapting the order of the map layers and the transparency of map layers for better readability of the maps;
- clicking on the map to find more information;
- zooming in on a particular area;
- sharing, embedding, and printing maps;
- finding the geographical coordinates of any location, or a location from its geographical coordinates;
- calculating distances between two locations as well as the surface area of polygons using the measure tool.
The resulting maps can easily be printed, integrated into presentations, lessons, and articles, shared on social media, and embedded in websites and blogs.
Work in your atlas with the My Maps function
The latest development concerns the addition to the Atlas of the My Maps function. With this new function, it is now possible to have your own working space in the Atlas to:
- save your selection of map layers;
- add a title to your map;
- generate a nice thumbnail or replace it with a picture;
- add a description of the map.
These maps are accessible only by you via a password, which can be created by following the instructions to obtain an EU login.
As this new function is in a pilot phase, the Atlas Team is currently looking for motivated teachers to test the My Maps function and provide feedback and ideas so that it can further be improved to meet teachers’ needs. Interested in contributing to the improvement of this new tool? Test it out and complete the online survey to submit your feedback!
A multilingual Ocean Literacy tool
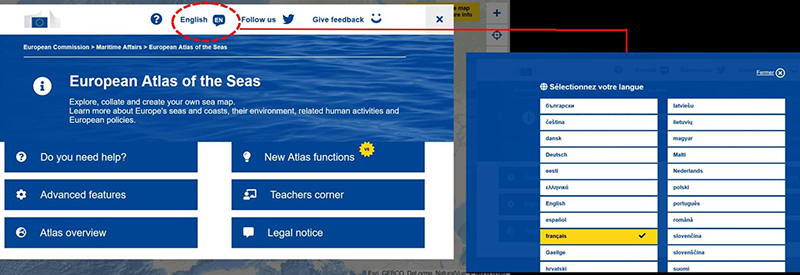
The European Atlas of the Seas is available in the 24 European Union languages and users can easily change the language in which they view maps. Thanks to the integrated interactive help tool, also available in 24 languages, teachers can gain a rapid understanding of how the Atlas works and have an overview of all of the available features and ways that the Atlas can be used in the classroom. Moreover, students can also become quickly independent in their use of the Atlas to carry out their own research for information.
© European Union
© European Union
Ready-to-use map-based educational activities
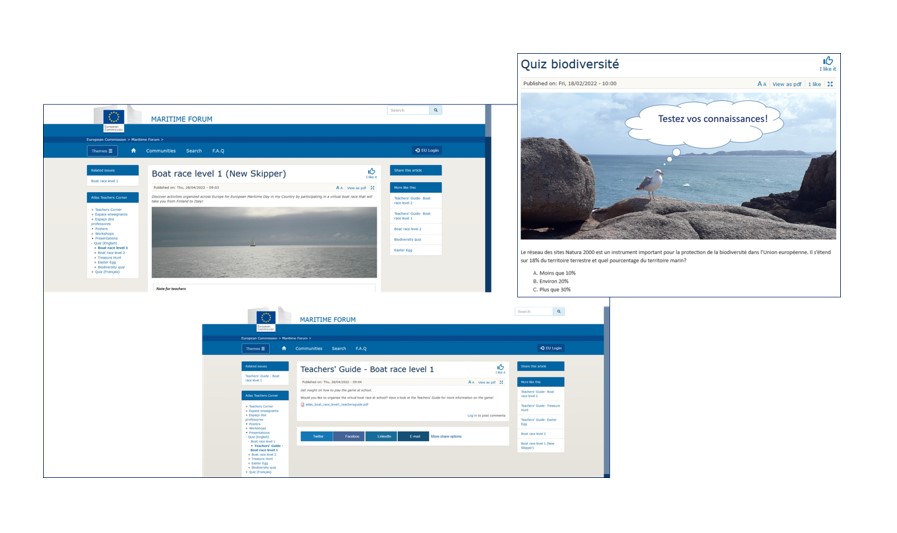
From the Atlas menu, teachers can access the Teachers Corner where they can find ready-to-use map-based exercises in English, French, and Portuguese for students of different age groups, as well as fun activities such as a Treasure Hunt and Virtual Boat Races!
© European Union
Students become scientists and data providers
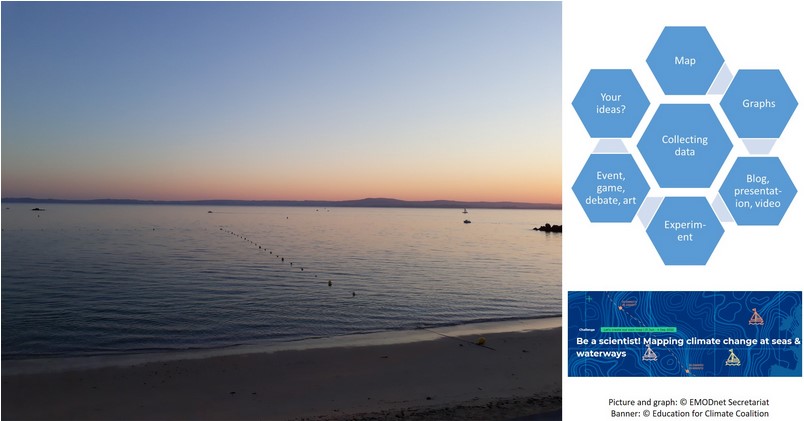
In 2022, an important step forward has taken place that allows for students not only to be users of the Atlas, but also to become data providers through the challenge for schools titled ‘‘Be a scientist! Mapping climate change at seas & waterways” organised by the Education for Climate Coalition and the European Atlas of the Seas.
Schools across Europe are invited to measure surface water temperature in the sea, rivers, lakes or ponds and to submit their data online to contribute to a new map in the European Atlas of the Seas.[2] The data collection process will end on 31 March 2023 and will be followed by data review and production of the new map in the following months. This map will be the first citizen science map in the Atlas!
© European Union
Relevance to curriculum topics and learning objectives
By using the European Atlas of the Seas, students can develop a multitude of competencies such as:
- reading, understanding, and interacting with a map;
- reading and understanding graphic information;
- creating a map using different map layers;
- measuring distances on maps;
- learning to search for information online and summarizing findings into a presentation;
- working in different languages.
The Atlas can be used in the classroom to expand knowledge of ocean science, geography, earth science, ecology, conservation, climate change, economics, and sustainable development. It can also support cross-curricular activities and school projects. In addition to being used in the students’ mother language, the Atlas can support the learning of other languages.
Your feedback is important
Your contribution as teachers and educators is essential to optimise the European Atlas of the Seas and ensure it meets your needs. Do not hesitate to send us your feedback, ideas, and suggestions via the feedback form accessible from the Atlas’ menu!
References
[1] Ocean Literacy: http://ioc.unesco.org/our-work/ocean-literacy
[2] Education for Climate Challenge: Students become Data Providers!: https://webgate.ec.europa.eu/maritimeforum/en/node/7469
Resources
- Find the European Atlas of the Seas
- A map of the week collection can be found on the EMODnet website.
- Read about the 7 Principles of Ocean Literacy.
- Learn about the EU4Ocean Coalition.
- Discover The European Marine Science Educators Association (EMSEA).
- Understand the role of the oceans in climate change: Harrison T, Khan A, Shallcross D (2017) Climate change: why the oceans matter. Science in School 39: 12–15.
- Try some classroom activities related to the thermal expansion of water: Ribeiro CI, Ahlgren O (2021) An ocean in the school lab: rising sea levels. Science in School53.
- Experiment with carbon dioxide and teach about ocean chemistry: Ribeiro CI, Ahlgren O (2021) An ocean in the school lab: carbon dioxide at sea. Science in School55.
- Find out about the physics at work beneath the waves with these classroom experiments: Watt S (2012) Movers and shakers: physics in the oceans. Science in School25: 28–33.
- Have your students predict the weather: Birba M, Kondilis T (2016) Wind and rain: meteorology in the classroom. Science in School 38: 36–41.
Review
Are you a teacher inspired by marine maps and willing to get your own customized maps? This article is perfect for you: it presents a rich and dynamic website where you can find, adapt and build multi-layered maps on a wealth of topics related to sea: geographical features, natural environment, economy, anthropogenic pressures, governance, politics and much more.
The article is written in a plain and clear style, making it suitable both for teachers and secondary school students, so dive and explore by yourself, to have a taste of the potentialities of the Atlas for the teaching and learning of Ocean Literacy.
Giulia Realdon, University of Camerino, Italy


