Albedo and ice: positive feedback in action Teach article
Author(s): Matteo Cattadori
Under the Sun, light colours stay cool, while black heats up. But what does this mean for the natural world? Let's explore the consequences of albedo.
The Earth’s climate is a complex system, and understanding how different factors influence it is crucial for our future. Albedo, a measure of how much sunlight a surface reflects, plays a surprisingly large role in this system. In this inquiry activity, we’ll explore the concept of albedo through a hands-on experiment, data analysis, and real-world connections.
This activity emphasises the fact that albedo acts according to the feedback model of action, a key mechanism in the climate system, where actions and reactions can amplify or dampen effects. The feedback mechanism is renowned as one of the essential principles of climate literacy.[1,2]
Positive feedback loop of melting sea ice Image: allison/Wikipedia, CC BY 4.0
This activity is most suitable for students aged 14–18, but it can be adapted for younger or older students, depending on their existing knowledge and skills.
The activity is presented according to the 5E instructional model of inquiry-based science education (IBSE).[3]
The 5E IBSE model contains the following phases:
Engage: the primary goal of the engagement phase is to ignite curiosity and interest. This is achieved by posing investigable questions that will become the focus of student-led investigations in subsequent phases.
Explore: students are given the opportunity to explore the topic in a practical way. The teacher acts as a guide, facilitating learning and encouraging students to draw their own conclusions.
Explain: students gather to share their observations and discoveries from the experiment and work collaboratively to develop an explanation for the observed patterns.
Elaborate: building on the experimental findings, the teacher now connects the experiment to real-world scenarios. This phase not only deepens students’ understanding of the topic, but also fosters critical thinking and interdisciplinary connections.
Evaluate: the knowledge and skills acquired by the students are assessed in this phase.
Building the setup
All parts and materials used in the experimental setup are clearly shown and explained in this video[4] and accompanying website.[5]
In this activity, the entire class participates in observing, measuring, recording, and performing a single experiment. Every student has their own worksheets and table of data. Ideally, the students should be able to perform the experiment themselves in groups; make enough setups to allow this.
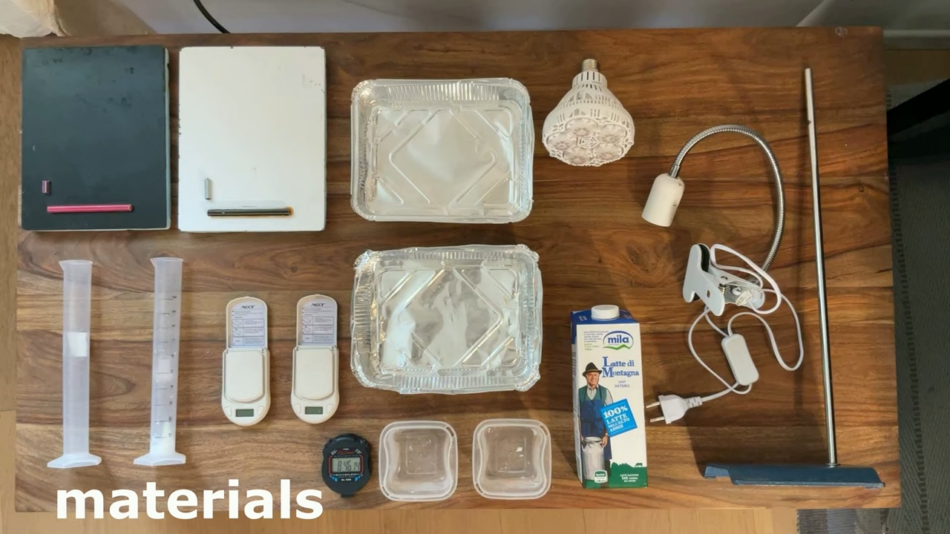
Materials
White paint
2 aluminium disposable baking pans
2 graduated cylinders
2 portable scales (to measure the melted milk)
2 small Tupperware boxes (to freeze the milk) with flat, even bottoms (the one used in the reference video is 80 mm × 80 mm)
Skimmed milk (1 litre) – full-fat milk can also be used, but skimmed milk is easier to clean up
A lamp to mimic sunlight (a solar greenhouse grow light, with at least a 24 W light-emitting diode, roughly equivalent to a 120 W incandescent bulb)
A stand to hold the lamp and books to elevate the stand (if needed)
A stopwatch
Hot glue gun and glue sticks
Pencil
A freezer
For the reflecting sheets:
Two metal sheets, with surface areas at 5 times those of the Tupperware boxes, and a thickness of at least 0.5 mm
Some Styrofoam board
Some wooden dowels
Black, with a “superblack” coating like Vantablack, or similar matt black paint
Image courtesy of the author
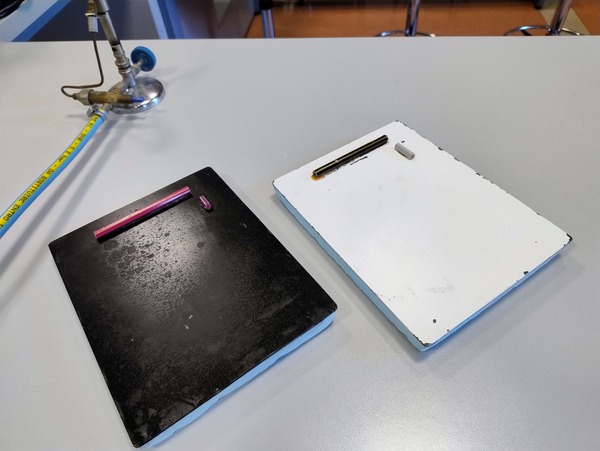
Assembling the reflecting sheets
The black and white reflecting sheets Image courtesy of the author
Cut the Styrofoam board into rectangles to match the metal sheets.
Cut the wooden dowels into short sections.
Paint one metal sheet with the black paint and the other with the white paint (or polish to a shine).
Glue the metal sheets to the Styrofoam boards, with the painted side facing outwards.
Glue two dowels along the edges of the metal sheets near one corner to act as a barrier to stop the ice sliding off.
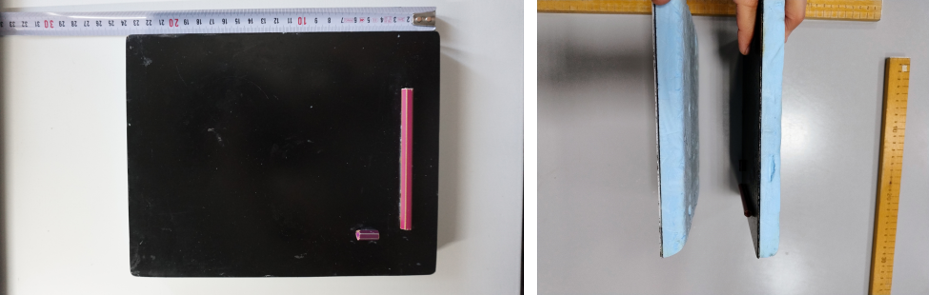
The black reflecting sheet from the top (left), and the two reflecting sheets from the side (right) Images courtesy of the author
Safety notes
This activity has minimal safety risks. Ensure the lamp is securely connected, melted milk avoids electrical components, and students don’t touch or directly look at the illuminated light source.
Procedure
Carefully weigh two portions of frozen milk and pour into identical Tupperware boxes. The layers of frozen milk must be identical in surface area and mass. Then carefully place the boxes horizontally in the freezer.
Cut a small hole in the corner of each baking pan, and place them on the edge of a table with the hole hanging over the edge. Ideally, there should be a slight slant to encourage the milk to drip out.
Place two measuring cylinders underneath the holes to catch the milk.
Set up the reflecting sheets in the baking pans at an angle with the corner, with the dowels at the bottom.
Just before starting the experiment, remove the frozen milk from the Tupperware boxes, and place on the reflecting sheets supported by the dowel rods.
Turn on the lamp, and start the timer to start the experiment.
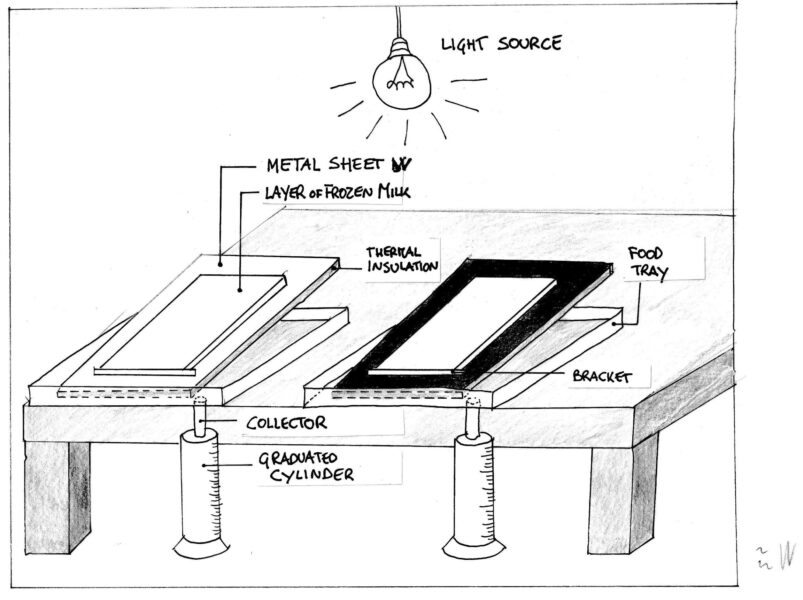
The experimental setup (diagram). The portable scales beneath the measuring cylinders are not shown. Image courtesy of the author
Phase 1: engage
The primary goal of the engagement phase is to ignite curiosity and interest in albedo and its pivotal role in understanding the interaction among sections of the climate system. Prerequisite knowledge of thermal energy, light and colours, and states of matter is required.
Time required: 15 minute + time the day before class to prepare the setup.
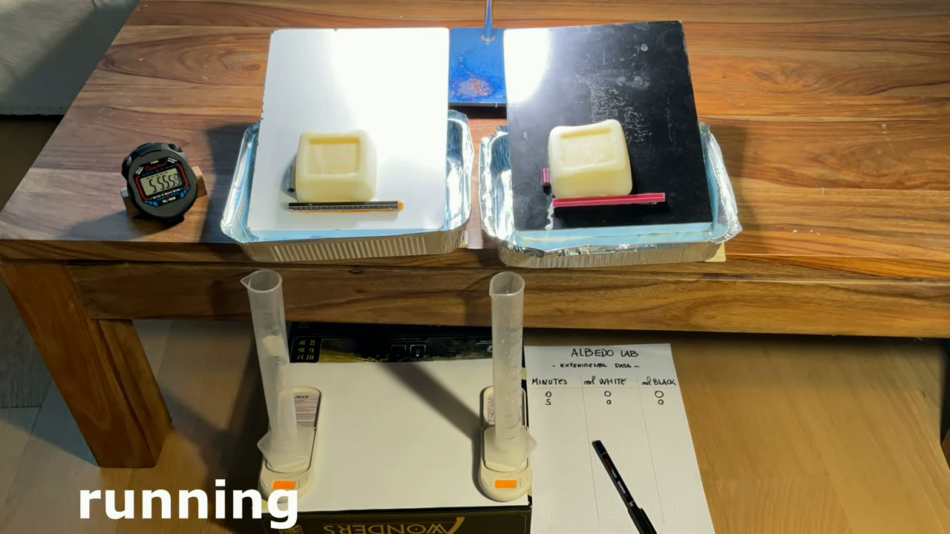
At the start of the lesson, the teacher dramatically reveals one of the experimental setups at the front of the class.
An image of the start of the experiment to illustrate the setup. Don’t turn on the lamps yet at this stage. Image courtesy of the author
The three key elements of the setup should be explained: the frozen milk, the metal sheets, and the lamp. Each of these represent a component of the polar environment, specifically sea ice, the ocean, and the Sun, respectively.
The teacher then hands out copies of the worksheet for students and takes advantage of the students’ sense of wonder to guide them in formulating hypotheses and answering the three key questions:
What’s going to happen when we turn on the lamp?
What are you expecting to happen to the two frozen surfaces?
Are you expecting to observe the same speed of melting on both reflecting sheets? Why?
The teacher encourages students to propose any kind of answers (even unusual ones) and to express them in any form: written texts, sketches, graphs, and so forth.
At this stage, the lamp should not be turned on.
Phase 2: explore
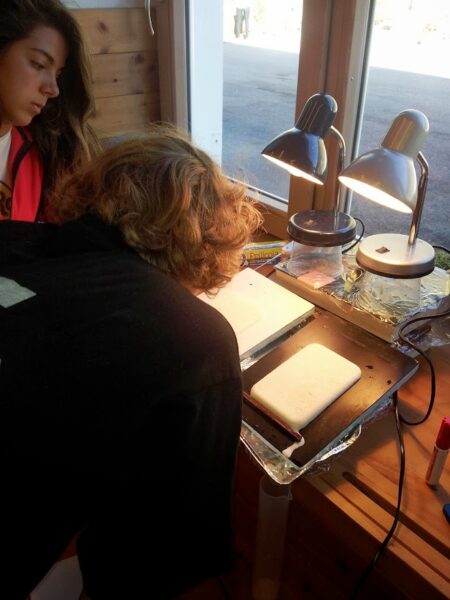
In the exploration phase, students are given the opportunity to explore the topic in a practical way. The teacher acts as a guide, facilitating learning and encouraging students to draw their own conclusions, but the students perform the experiment autonomously.
Time required: 60 minutes.
Image courtesy of the author
Materials
Enough experimental setups prepared before the class (with enough time for the milk to freeze) for the students to work in groups
Divide the students into groups, and introduce the task and hand out Worksheet 2.
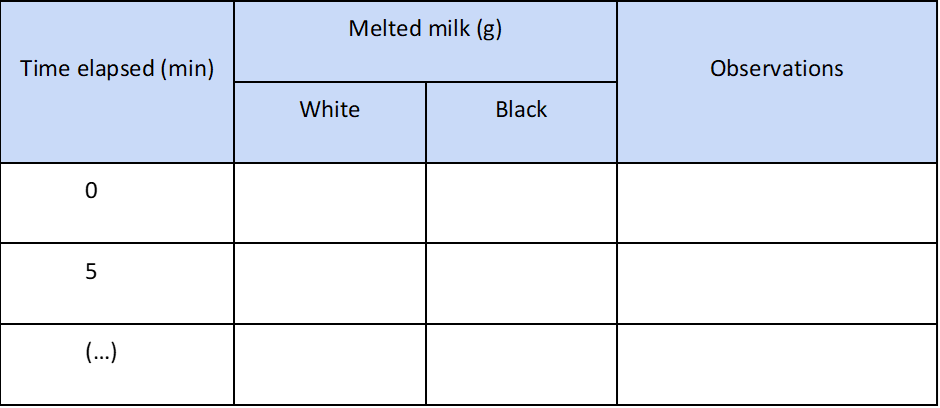
Make sure students have an appropriate data collection table, with space to record the mass of melted milk from the white and black plates every 5 minutes, and space to make observations.
The teacher should encourage students to observe the setting carefully, as well as all the events happening (change in shape of the frozen layers, formation of drops of condensation, mistakes in the procedure, etc.), and take notes in the observation column of the table.
Students can then start the experiment by turning on the lamps and starting the timers.
Every 5 minutes, they should read both scales carefully and simultaneously, indicating masses of melted milk collected inside the two cylinders, until the two frozen sheets (W and B) are completely melted, and record the data in the table.
After turning on the lamp, the teacher allows the students to independently measure the time elapsed and record the masses of milk collected. The teacher does not correct wrong actions or hypotheses and does not provide answers, but simply supports, encourages, and listens, moving around the class.
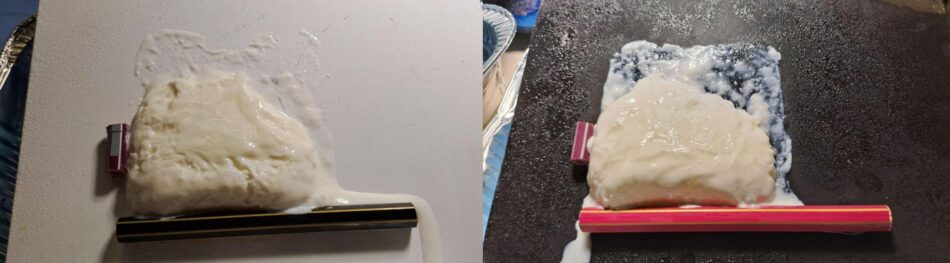
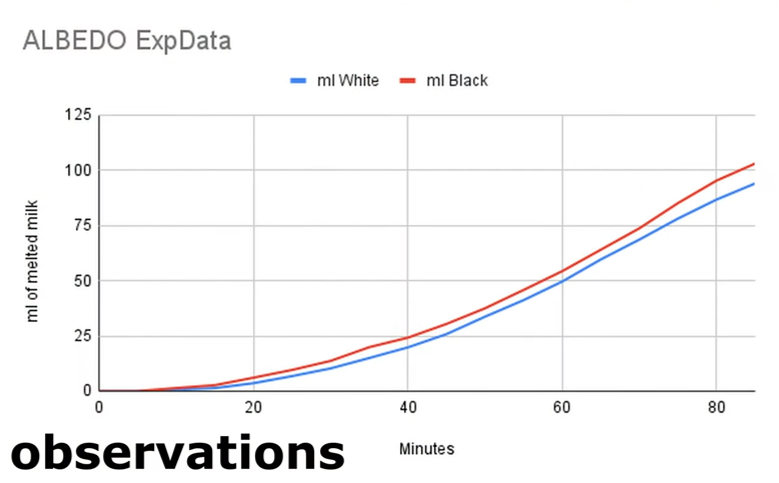
As the experiment progresses, students should begin to notice the importance of focusing on the masses of milk collected under the two conditions at the same time, and, in particular, on the mass difference (Δ) between them. They should also come to observe that this delta progressively increases as time passes over the course of the experiment.
Melting proceeding under the two conditions Image courtesy of the author
Once the ice blocks have melted, the data should be plotted on a graph.
The students should then answer the questions on the worsheet, and calculate the rate of melting for each sheet.
Phase 3: explain
In this phase, students gather in small groups to share their observations and discoveries from the experiment, and work collaboratively to develop an explanation for the observed patterns. This phase is essential for deepening the students’ comprehension of the scientific principles underlying the experiment and linking them to a broader understanding of the role of feedback interactions within the climate system.
Time required: 30 minutes.
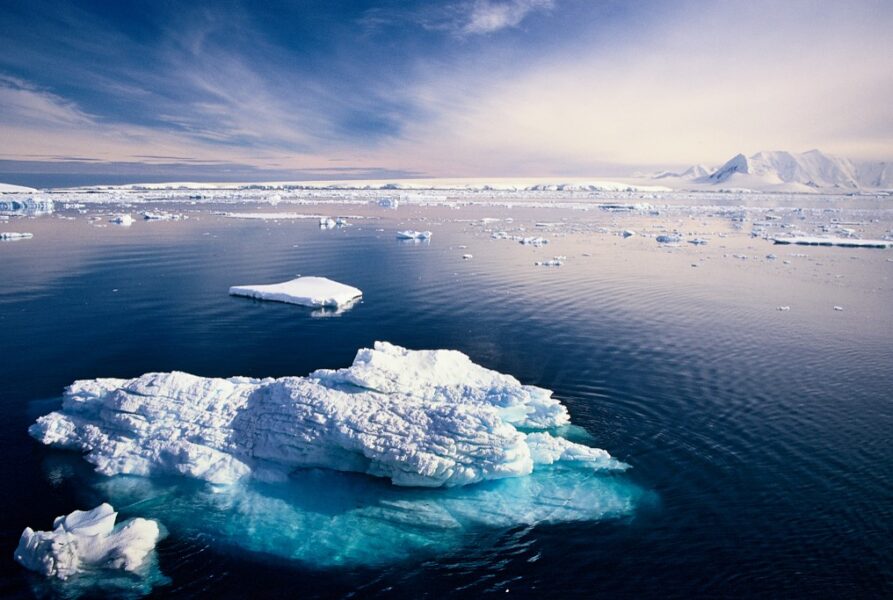
Melting arctic sea ice, showing the stark contrast between white ice and very dark seawater Image: Peter Prokosch/Flickr, CC BY-NC-SA 2.0
Materials
Worksheets and results from the previous phases
Procedure
The teacher defines and briefly describes four key terms: albedo, reflectivity, absorption, and solar radiation.
Then the teacher forms small groups of three to four students and encourages the groups discuss and agree on answers to the three key questions posed in phase 1 using the four key terms just introduced.
Through questioning and prompts, the teacher can help the students to articulate their answers based on an understanding of the experiment and proper use of the scientific terms provided. These answers should explain the relationship between surface colour, heat absorption, and the melting rate of ice.
The teacher launches a plenary session where the whole class compares and discusses the answers. Here, the teacher might start to steer the conversation towards the analogy between the experimental setting and natural polar environment. Showing an image like the one above could help students see the stark contrast between the white sea ice and dark seawater.
For older students, the teacher can consider introducing the concept of a positive feedback loop, helping students intuitively grasp how the melting of ice on the black surface exposes more of the dark surface, leading to increased light absorption and further melting.
Phase 4: elaborate
Building on the previous answers and findings, the teacher now connects the experiment more deeply to real-world scenarios, elaborating on implications of the impact of the decline in ice in the Arctic Sea on the Earth’s albedo.[6] This phase not only deepens students’ understanding of albedo and feedback loops, but also fosters critical thinking and interdisciplinary connections.
Time required: 20 minutes.
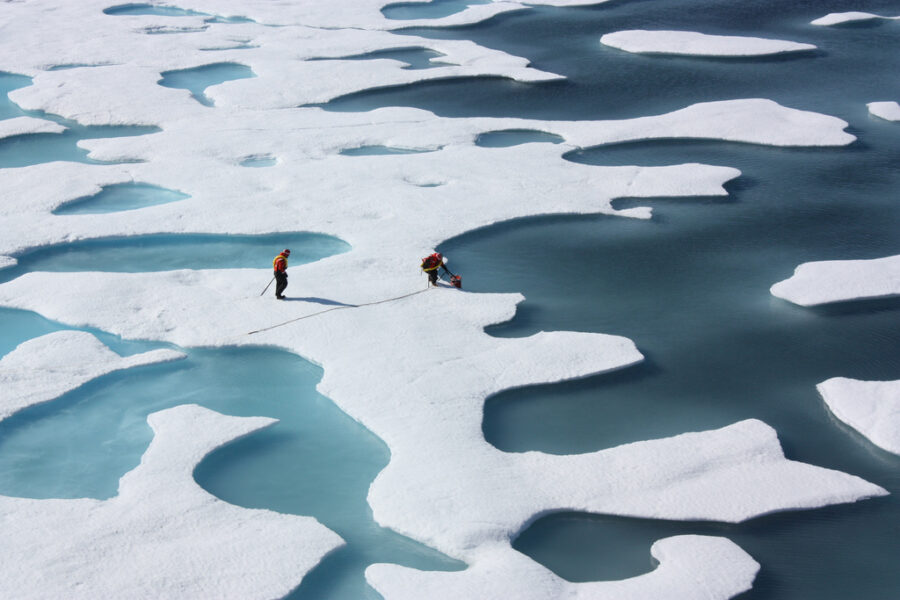
Even the shallow meltwater ponds that form on top of sea ice as it melts are much darker than the ice itself. Image: Kathryn Hansen/Wikipedia, CC BY 2.0
The teacher encourages students to consider the diagram on Worksheet 3, which represents the processes in nature during melting sea ice, and to write a text describing what is happening at each step and the feedback-type interaction.
Image courtesy of the author
The students should then read the article on positive climate feedback, which expands on the idea of feedback, with the additional terms ‘positive’ and ‘negative’, and answer the questions on the worksheet.
Finally, students are challenged to discover additional examples of feedback loops in other subjects, such as homeostasis in biology or feedback loops in computer programming, further demonstrating the interconnectedness of this concept across disciplines.
Older/more advanced students can also answer the question on broader climate interactions.
Phase 5: evaluate
The evaluation phase aims to assess the knowledge and skills acquired by the students.
Give students the measured albedo values for different surfaces.
Ask them to list the albedo data for the following nine surfaces: forest, grassland, sandy desert, ocean, fresh snow or ice, spring snow or old ice, sea ice, clouds, and asphalt.
They should then imagine nine alternative planet Earths, each fully covered by one of these surfaces and order the planets from hottest to coldest.
The students can then check their answers using the albedo stimulator tool.
Optional extension activities
This activity is adaptable to various modifications (even those suggested by the students themselves), which can broaden the educational contexts where it can be applied:
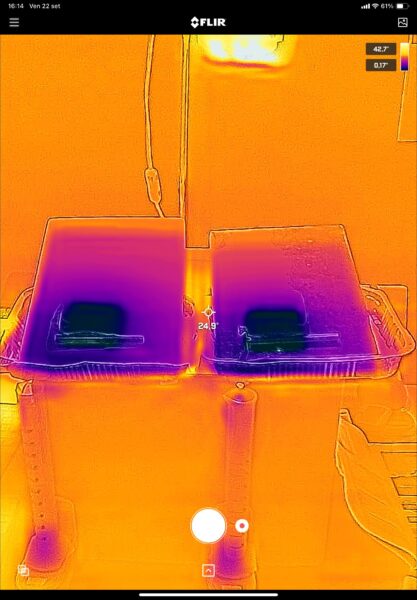
Temperature measurements: various measurements can be taken, such as surface temperature, using appropriate sensors or a thermal infrared camera. These measurements can even be performed continuously using a data-logging system.
Experimental setting: different lamps can be used, varying in power, light type (coloured, UV, or infrared), or angle of incidence. The frozen milk can be used to simulate diverse conditions, like adding a few grams of ash to represent volcanic eruption deposits.
A thermal image of the experiment Image courtesy of the author
Additional parameter measurements: students can measure brightness (with a lux meter or app) or analyze images with tools like Tracker software to quantify reflected light and albedo.
This activity was designed and carried out as part of the Education and Public Outreach program during the Fourth International Polar Year (2007–2008). The International Polar Year is a global joint initiative focused on research, study, and raising awareness about the importance of polar regions. The Fifth Polar Year will take place in the 2032–2033 biennium.
Read about the role of our oceans in climate change: Harrison T, Khan A, Shallcross D (2017) Climate change: why the oceans matter. Science in School39: 12–15.
Discover how the unique characteristics of seagrasses are vital for the health of our planet: Crouch F (2024) Seagrass the wonder plant!Science in School 67.
Author(s)
Matteo Cattadori is a high school science teacher in Trentino, Italy, specializing in polar science education. He is a member of Polar Educators International.

.jpg#/media/File:Sea_Ice_Melt_Ponds_(938).jpg)