Wall of stars: illuminate stellar life cycles with physics and coding Teach article
Author(s): Jed Marshall
Written in the stars: use microcontrollers and LEDs to model stellar life cycles, scaling billions of years into minutes while exploring stellar evolution.
Introduction
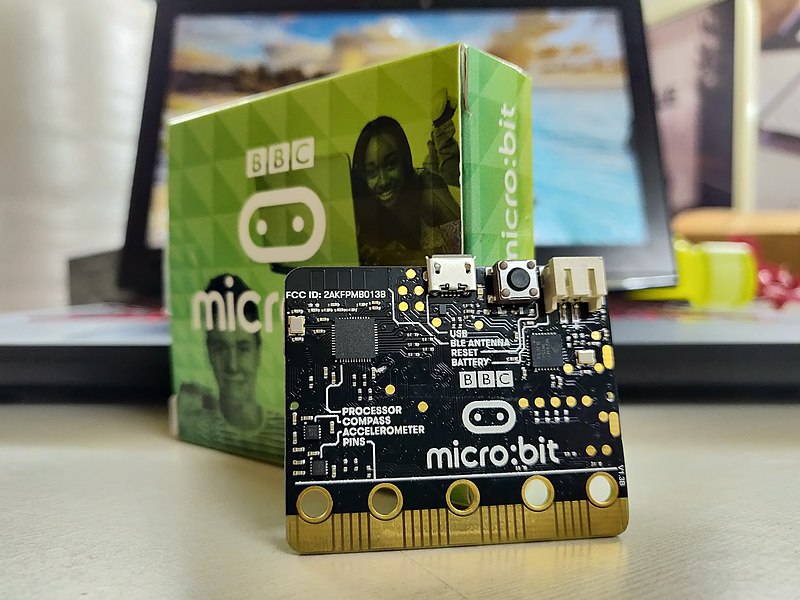
Stars undergo fascinating evolutionary processes over millions or billions of years, but these vast timescales can be difficult for students to grasp. This project offers a hands-on approach that makes stellar evolution tangible and engaging by using microcontrollers like BBC micro:bits and red–green–blue (RGB) light-emitting diodes (LEDs) to create proportionally scaled models of stellar life cycles. Students will translate astronomical data into programmable light sequences, visually representing the changing colours and relative durations of each stellar phase. The project emphasizes computational thinking, problem-solving, and collaborative learning, while reinforcing key astrophysics concepts. It serves as an excellent complement to tools like the stellar evolution software Window to the Stars.
Image courtesy of the author
Learning Objectives: identifying stellar life-cycle stages, understanding vastly different stellar timescales, applying proportional scaling, developing microcontroller programming skills, and collaborating to solve modelling challenges.The principles of using a microcontroller to change the colour profile of an RGB LED can be used with any common microcontroller used in schools. Here, we use the BBC micro:bit; however, the principles will also work with Arduino, Raspberry Pi, or Crumble microcontrollers. If you have not used a micro:bit before, there are plenty of beginner tutorials on the BBC micro:bit website.
These activities are suitable for students aged 11–19 (adaptable based on coding experience).
Safety notes
Electronic components should be handled with care. Ensure alligator clips do not cause short circuits by touching each other on micro:bit pins, and check all connections are secure before powering on. Supervision by the teacher is recommended for younger students or those new to electronics.
Activity 1: Understanding stellar life cycles and timeline challenges
Before students can model stellar life cycles, they need to understand what they’re modelling and why the timescales present such an interesting challenge.
Recap stellar-evolution basics, adjusting depth for prior knowledge. Cover star formation, main-sequence burning, and mass-dependent end points.
Image courtesy of the author
Introduce the project goal: using micro:bits and LEDs to create proportional models of stellar life cycles, where LED colours represent evolutionary stages.
Organize students into groups of two or three. Half research Sun-like stars (~1 solar mass), and half research high-mass stars (~20 solar masses).
Groups research stellar timescales, that is, how long the stars spend at each stage, presented in millions or billions of years:
Sun-like stars: protostar (50 million years), main sequence (10 billion years), red giant (1 billion years), and white dwarf formation (100 million years).
High-mass stars: protostar (0.5 million years), main sequence (7 million years), red supergiant (1 million years), and supernova (instantaneous).
Introduce the scaling challenge: compress these timescales into a 10-minute model. We turn these timescales into a shorter time so that we can ‘play out’ the full evolution of the star using the micro:bit. Students can change the length of their programme later, but 10 min is a good starting point.
Students create and populate a simple table that maps stellar events from several billion years into 10 min.
Star stage
Stellar time
10-min model
Star colour
Protostar
1 million years
5 s (would be shorter but important to see)
Dim red
Main sequence
10 billion years
9 min
White/yellow
Red giant
1 billion years
55 s
Red/orange
White dwarf
A very long time
Choose a time before the model starts again
Dim white/yellow
Activity 2: Hardware setup and LED-colour exploration
Students become familiar with the hardware and learn how RGB LEDs can represent the colours of a star in its different stages and tell the story of a star by changing the colour of the RGB LEDusing micro:bit.
Students can write this code using JavaScript (traditional written code) or MakeCode blocks (graphical block-based programming), depending on their coding experience. Coding blocks are shown here to help guide students, and a JavaScript code example for colour mixing and is given in the supporting material.
Students or teachers unfamiliar with jumper cables and using prototyping boards can research their basic function. A detailed article explaining prototyping boards and jumper cables can be found online.
This activity takes 30–40 minutes.
Materials
Per group of 2–3 students
1 × BBC micro:bit or other microcontroller
Computer with internet access for Computer with internet access for MakeCode editor[1]
1 × USB cable (for programming and power)
1 × RGB LED for micro:bit (recommend Monk Makes RGB LED with integrated resistors[2])
3 × 470 Ω resistors (if not using the Monk Makes version)
4 × jumper cables or alligator clips
Procedure
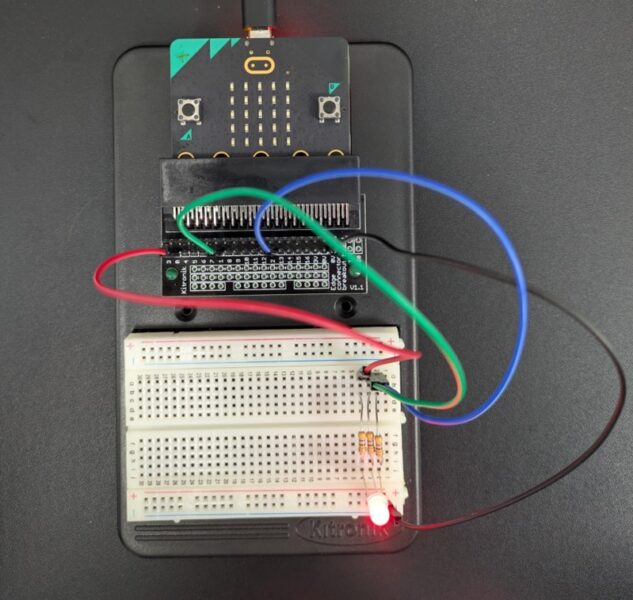
Students should connect the RGB LED to the micro:bit using jumper cables. Connect the ground to GND, red to P0, green to P1, and blue to P2 (via resistors if needed).
Test basic LED controls using the MakeCode editor. Start with a simple red light.
Image courtesy of the author
Students should use their knowledge of light and colour mixing, along with some trial and error, to experiment with different colours. This can be done by writing analogue values between 0 (no brightness) and 1023 (maximum brightness) to pins P0, P1, and P2, representing red, blue, and green, respectively.
Students should explore stellar colours by creating RGB combinations representing different stellar types, noting down the RGB values in the table from Activity 1: a) Cool red stars (protostars, red giants): high red, low green/blue b) Yellow–white stars (Sun-like): balanced warm colours c) Blue–white stars (hot main sequence): high blue/green, moderate red d) White stars (white dwarfs): balanced RGB values
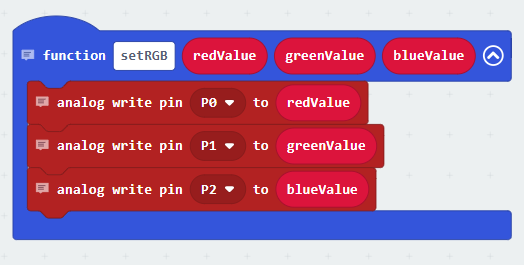
To make the handling of the colour settings more comfortable, create a reusable function in, for example, JavaScript or block code.
Screenshot taken from Microsoft MakeCode Image courtesy of the author
Activity 3: Programming stellar life cycles
Students combine their timeline understanding with coding skills to create functioning stellar models. Stars don’t live forever, and their various life stages have vastly different durations. A Sun-like star might spend billions of years in its stable main-sequence phase, while its later stages are much shorter. High-mass stars live even faster, more dramatic lives.
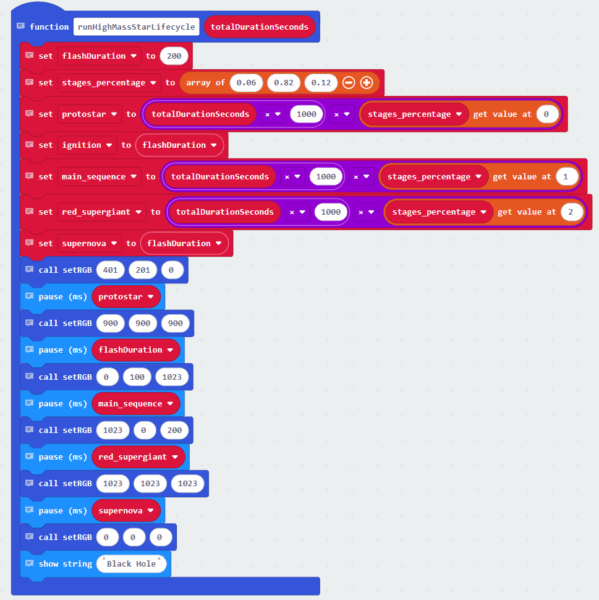
Students use the same materials as in Activity 2 and can write the code using JavaScript (traditional written code) or MakeCode blocks (graphical block-based programming), depending on their coding experience. Coding blocks are shown below and a JavaScript code example for high mass stars is given in the supporting material. Full example code (in both forms) with comments is also provided.
This activity takes 45–60 minutes.
Procedure
As a class, decide on a total runtime for the stellar life-cycle model. Good starting points are 30 s (for quick testing) or 10 min (600 s, for a more detailed display).
In the next steps, students need to calculate appropriate times for the different life stages of the two star types. Each group should do this for their assigned star type; the example shown below is for a solar-mass star.
Howmany real years should 1 s of the model represent? This is the scaling factor. For example, if the Sun’s main sequence is 10 billion years and we want it to last 5 min (300 s) in the 10-minute model, what would the scaling factor be? Challenge question: if 1 billion years of a star’s life is represented by 30 s in the model, how long would a 50-million-year protostar phase be?
Some events, like the Sun’s ignition flash or a supernova, are astronomically very brief. In the model, it makes sense to give these a fixed, short duration (e.g., 0.2–0.5 s), so they are noticeable.
If a stage is very short in reality (like the Sun’s protostar phase relative to its main sequence), its scaled time might become too brief to see on the LED. Decide on a minimum observable duration for any nonflash stage (e.g., 1–5% of the total time) such as 1–5 s. While this is not ‘realistic’, it still allows us to see every stage and important event for the star.
Tip: it is useful to use seconds for the function input, which will decide how long the simulation runs; however, calculations will be done in microseconds. Convert seconds into microseconds by multiply by 1000.
The table created in Activity 1 was for 10 min; however, we might want to use different timescales. Use percentages and the input runtime to determine the length of each stellar stage. This information will be stored in an array (a programming term for a table; see the annotated example code). ‘Short’ events don’t need to be included, as these would be impossibly short to represent on the scale. We want to represent each stage of the stellar life cycle as a percentage of the overall time (e.g., perhaps 91% or 0.91 for the main-sequence stage). The total life-cycle duration is multiplied by the percentage to get a value for how long this stage lasts.
Use mathematics to create time durations for each stage. Remember to use an appropriate short time (e.g., 0.2 s) for any ‘flash’ or short event, because if they were truly to scale, they would be imperceivable.
The pause function can be used to maintain the current RGB values for a given value of time. After setting the RGB values for a particular stage (e.g., protostar), we then want to pause for the correct length of time for that stage.
Add a trigger, such as button A being pressed, to call the function (to call a function means to use that function in the code) for the Sun’s story. Remember the input is total runtime in seconds. We can adjust this to 10–30 s to trial the stages, but then we may wish to set it to 600 s for it to take 10 min.
Call the function and test the stars.
Screenshot taken from Microsoft MakeCode Image courtesy of the author
Activity 4: Creating a classroom star wall
This part is optional, but it’s a nice way to bring the project together and give the students the opportunity to display their work.
Transform individual models into a collaborative classroom display to demonstrate stellar diversity. Each group can be given a black interlocking foam floor tile, which can then be joined together at the end.
This activity takes 45–60 minutes.
Materials
A star setup per group, as created in Activity 3
Dark backing material (interconnecting foam floor tiles work well)
Battery packs
Mounting materials (e.g., Velcro tape or screws and spacers)
Procedure
Each group is given a tile or section of the display.
Select a random position within this tile to mount the star. The micro:bit and battery pack can be mounted on the pack of the tile; a small hole can be made with a sharp pencil to place the LED through.
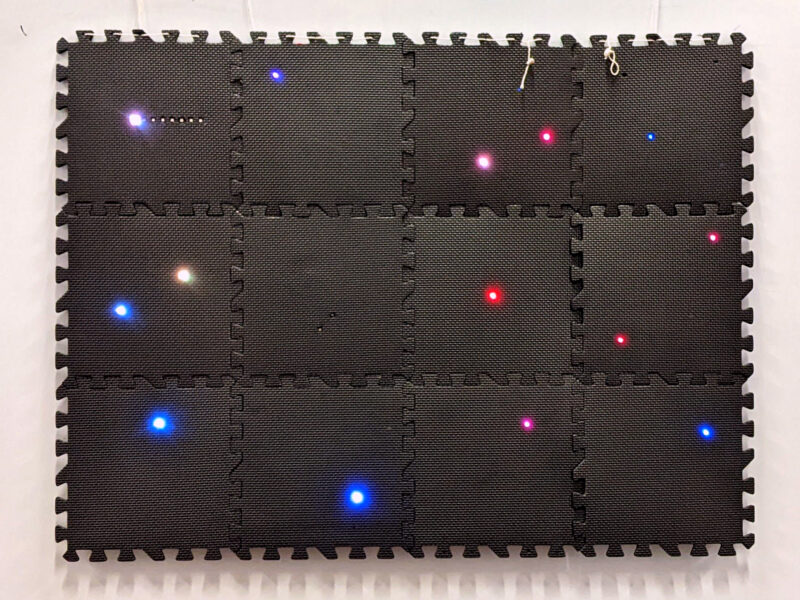
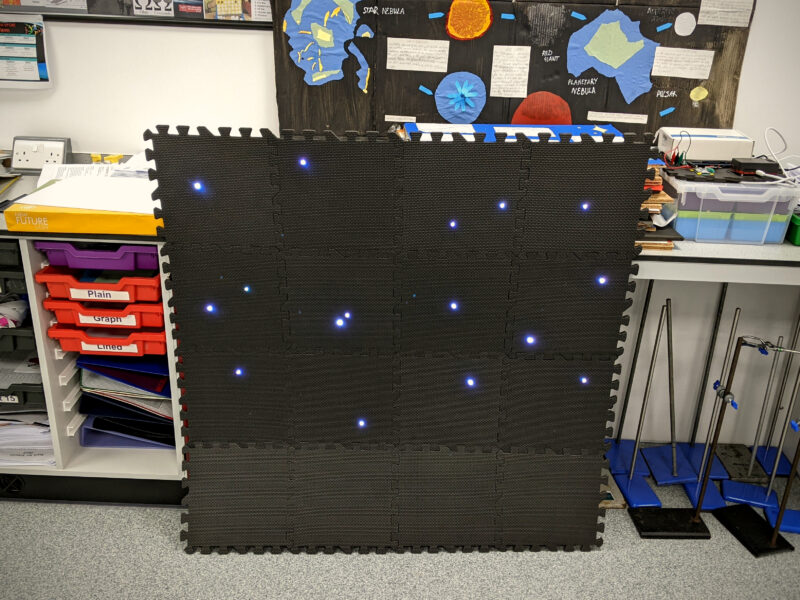
The tiles can then be joined together to create a night sky/star field. Students can start their programmes at random times to demonstrate that our night sky is ever evolving and changing.
Image courtesy of the author
This will happen with our night sky, but over several billion years. The star Betelgeuse is due to supernova within the next 150 thousand years. Will civilizations in the future use the same constellations and asterisms?
One key feature that is not reflected by the model is that high-mass stars will have a much shorter lifetime than those that are Sun-like. This should be discussed, and as an optional extension, the model can be modified to reflect this.
Optional extensions
Modify the timescales of the models so that Sun-like stars and massive stars are to scale with each other. While the development of a Sun-like star takes an hour, massive stars reach the end of their lives after just a few seconds. After the death of a massive star, another massive star (the same LED) begins to shine after a random pause. This way it becomes apparent that massive stars pop up in galaxies like fireworks, while Sun-like stars need a long time for their evolution.
Students can invent constellations from the fantasy star field they have created. They can map the random positions of the stars onto a grid and try to create shapes, animals, or mythologies about the patterns they spot. This is also an opportunity to discuss the cultural aspects of astronomy.
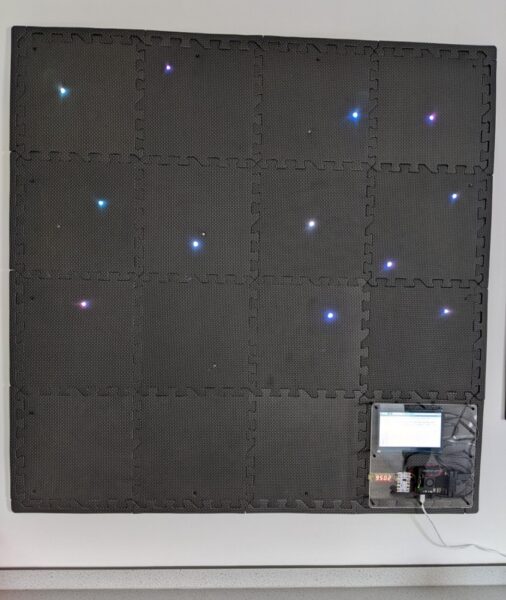
A final star display showing the interlocked foam tiles and randomly placed LEDs. A Raspberry Pi and a spare Crumble microcontroller are also included so users can programme their own star should they choose. Image courtesy of the author
Discussion
This project provides a compelling and interactive method for students to engage with the vastness of stellar evolution. By translating abstract astronomical data into a tangible, light-based model, students not only reinforce their understanding of scientific concepts, but also develop crucial skills in programming, problem-solving, and collaborative design. The journey from a single LED to a classroom constellation can illuminate the wonders of the cosmos in a uniquely memorable way.
Students discover that main-sequence phases dominate stellar lifetimes, high-mass stars evolve dramatically faster than Sun-like stars, and scaling vast timescales requires careful mathematical consideration.
How do stellar colours relate to temperature and evolutionary stage?
What challenges do astronomers face when studying processes that take millions of years?
How might stellar evolution affect planetary systems?
Acknowledgements
This project was developed with support from a Royal Society grant in partnership with Alexandra Park School, University of Surrey, and NEXT+ Vibenshus Gymnasium in Copenhagen. We thank the BBC micro:bit Foundation, MakeCode developers, and the Window to the Stars[3] team for their educational resources.
Learn more about the Sun’s spectrum and what the stars are made of: Ribeiro CI, Ahlgren O (2016) What are stars made of?Science in School 37: 34–39.
Use light bulbs to explain why stars shine in different colours: Ribeiro CI (2015) Starlight inside a light bulb. Science in School31: 37–42.
Get your students to use their smartphones for some hands-on astronomy: Rath G, Jeanjacquot P, Hayes E (2016) Smart measurements of the heavens. Science in School36: 37–42.
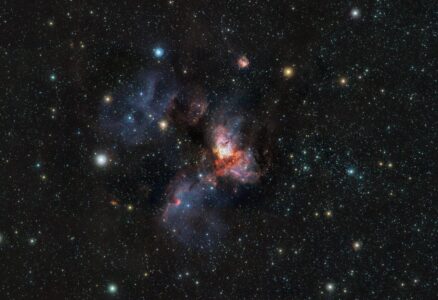
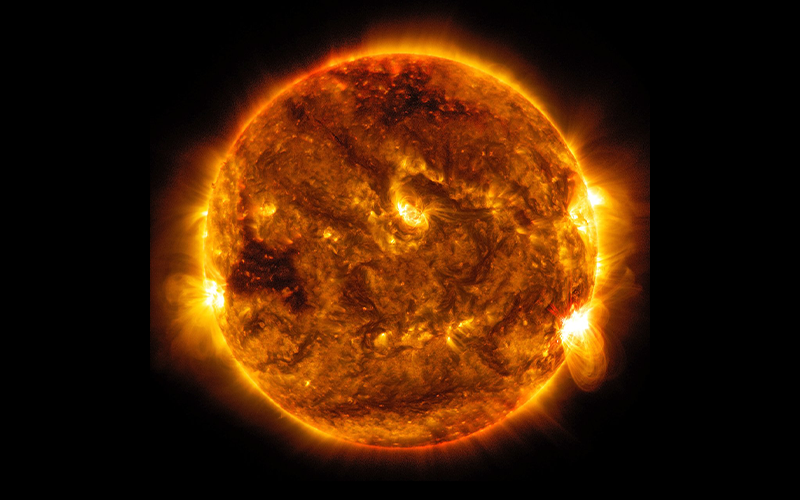
The colours of stars tell us a lot about their physical state at the time they emitted the light that we are currently receiving through telescopes. But they also tell us something about their evolutionary stage, their past and their possible future. That’s why it is very important to study all colours of light, including those that are invisible to the human eye, such as infrared light, microwaves, radio waves and many more. In the following articles and an ESO blog post, you can learn more about ESO’s current research in these areas.
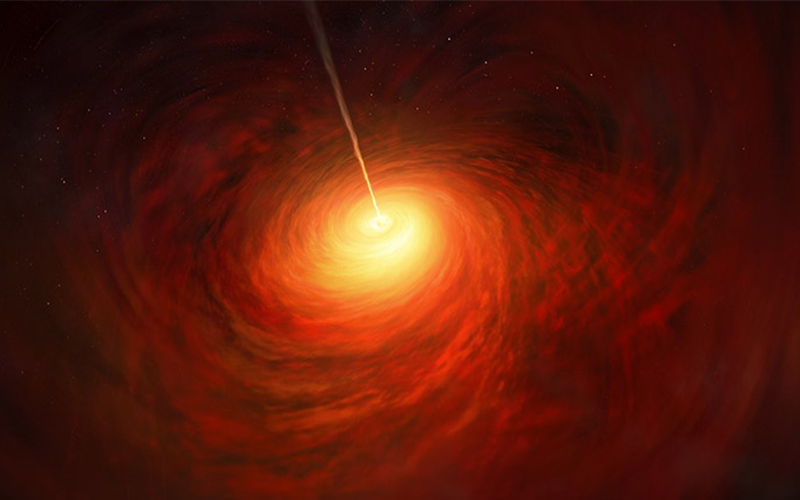
This is the story of how scientists created an image of the region around the black hole at the centre of our galaxy by combining many telescopes into one virtual telescope the size of the Earth.
Astronomy / space, Engineering, News from the EIROs, Physics