


The centrifugal force awakens Teach article
This activity was presented at the Science on Stage Festival 2022 ![]()
In a spin: use a rotating platform to explore how gravitational acceleration affects a simple pendulum.
This article describes the presentation of an experimental device that allows the experimental study of a simple gravity pendulum.[1]
With the help of this experimental device, students can study the dependence of the period of a simple gravity pendulum on gravitational acceleration. This objective has been challenging for a long time, since it is hard to find a practical way to change the acceleration due to gravity.
Using a simple gravity pendulum to investigate how gravity affects a pendulum’s period
In this project, students aged 16–19 will be able to use the suggested experimental setup to modify the gravitational acceleration experienced by a simple gravity pendulum and observe how the pendulum’s period is affected by it. They will also practice taking measurements, sketching graphs, and drawing conclusions from experimental results.
Due to the lack of a practical way to change the acceleration of gravity, most teachers resort to computer simulations to experimentally investigate the dependence of the period of a simple gravity pendulum on gravitational acceleration. The experimental setup presented is relatively simple to construct and is low cost.
This experimental setup uses the theory of artificial gravity,[2] where, within noninertial reference frames, pseudoforces[3] (or fictitious forces) appear that can simulate gravity. So, in such a case, if we place a pendulum on a horizontal rotating platform, centrifugal force replaces weight, and, by varying the angular velocity of the rotating platform, we can vary this artificial gravity as well.
The measurements can be made within a lesson. The full experiment, including planning, making measurements, analysis, and discussion takes 90–120 mins and may take up to three lessons, depending on the approach chosen by the teacher.
A video summarizing the activity can be found here.
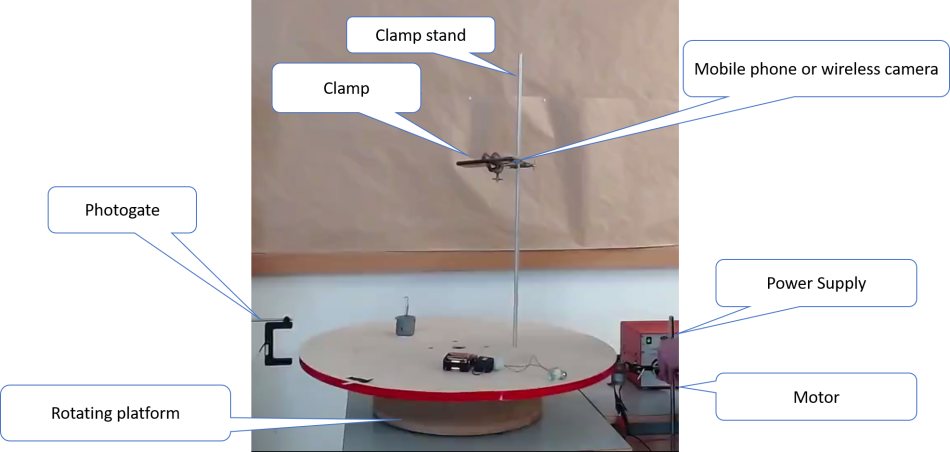
Activity 1: Assembling the rotating-platform apparatus
First, a rotating platform with attachments for a pendulum and filming device is assembled from simple materials. It should take about 20 minutes to assemble the device.
Materials
- rotating platform
- rod
- clamp
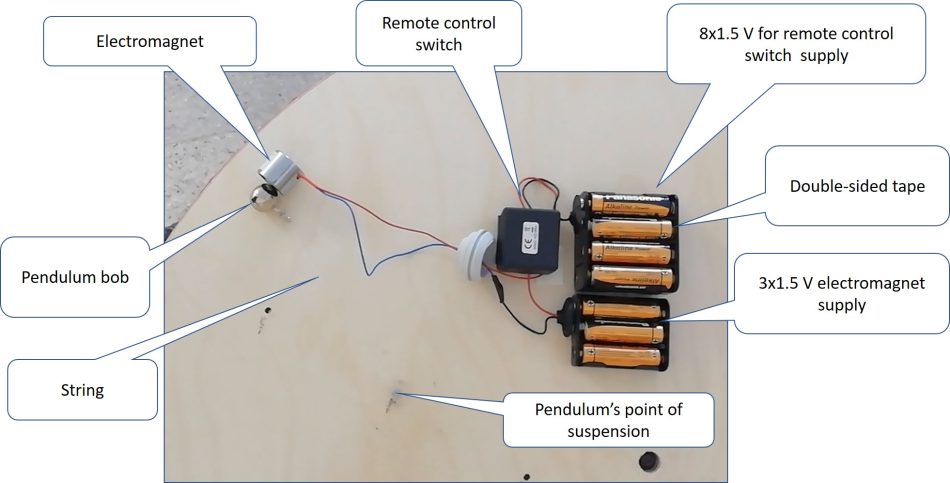
- electromagnet (6 V)
- switch controlled by a wireless remote control
- photogate with timer
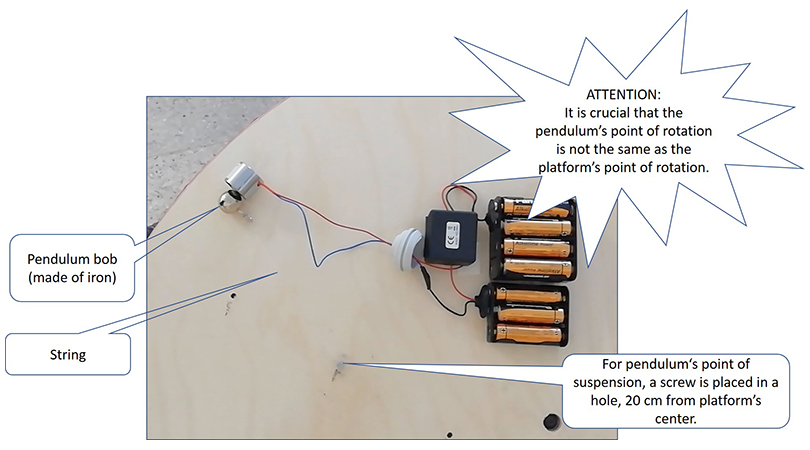
- bob
- string
- double-sided sticky tape
Procedure
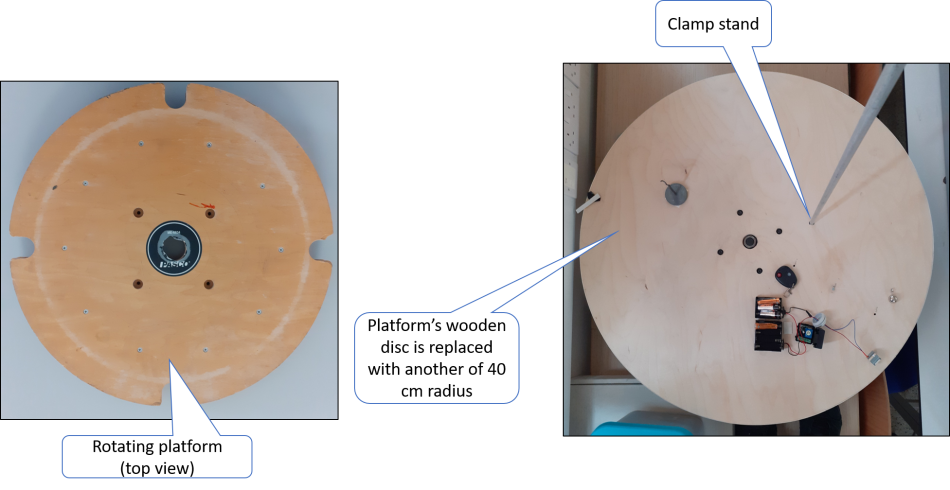
- Fit the rotating platform with a wooden disc with a radius of 40 cm (optional).
- Place the electromagnet, connected to a wireless switch, on the wooden disc.
- Attach the pendulum to the disc, taking care that the pendulum’s point of rotation doesn’t match the platform’s point of rotation. The distance between the two points is suggested to be 20 cm.
- Attach a rod with a clamp to the disc, where the wireless camera will be placed.
- Fit the photogate with a timer near the rotating platform, so that it will measure the platform’s period/angular velocity.
Activity 2: Making measurements
This experimental setup can be used either as an experimental verification for students that already know the theory of a simple gravity pendulum (recommended) or as an experimental study of an unknown natural phenomenon.
In the first case, students already know that the pendulum’s period squared is proportional to the inverse of the value of artificial gravity. They know that, to verify this theory, they need to measure the pendulum’s period for different values of gravity acceleration, while keeping all other physical quantities constant. The theory is verified either by calculating the factor T2g, and showing that it is constant (this method is very sensitive to systematic errors), or by drawing a graph of the pendulum’s period squared versus the inverse of the artificial-gravity value and showing that graph is a straight line with nonzero gradient.
In the second case, the steps of the scientific method should be applied, and different graphs might be sketched before students draw a conclusion.
It will take around 40 minutes to take measurements, depending on how accustomed are your students to video analysis programs. Data analysis can be done either in classroom or as a homework and it takes another 40 minutes. Additional time should be allowed for drawing conclusions and further discussion afterwards.
Materials
- The rotating platform assembled in activity 1.
- A smartphone or wireless camera
- Graph paper or a laptop/ tablet with a graphing program
Safety notes
The device is very safe for students to use. The only thing that may be damaged is the wireless camera/mobile phone, although, if you are planning to achieve bigger artificial accelerations (it is possible to achieve up to five times earth’s gravity acceleration), a safety screen should be used.
Procedure
Making measurements
- Write down the platform’s period (Rplatform) and the pendulum’s length.
- Deflect the pendulum’s bob that is attached to the electromagnet (switch it on).
- Place the wireless camera/mobile phone on the clamp and set it to record (use a hairband or adhesive tape for extra protection).
- Set the platform rotating (an electric motor can be used to achieve higher frequencies) until the desired velocity is achieved, as measured by the photogate.
- Turn the switch off via the remote control and let the platform perform another 3–5 revolutions.
- Stop the platform and stop the video from recording. Before the recording is stopped, the achieved period can be said aloud or recorded on paper.
- Repeat the process another 5–7 times for different platform periods.
Data analysis
- Retrieve the phone and, from the videos recorded, measure the period of the pendulum. Record the platform’s period and the pendulum’s period in a table. It is recommended to use a video analysis program to do so.
- In another column, calculate the centrifugal acceleration (artificial gravity acceleration) by using the formula
- Calculate the square of the pendulum’s period in a different column.
- Calculate the inverse of artificial gravity in another column.
RESULTS:
| Rdisc (m) | Tdisc (s) | acentrifugal = gartificial = ω2discRdisc (m/s2) | Lpendulum (m) | Texperimental (s) | T2g (sm) |
|---|---|---|---|---|---|
| 0.40 | 0.56 | 50.00 | 0.165 | 0.59 | 17.4 |
| 0.40 | 0.60 | 43.86 | 0.165 | 0.65 | 18.5 |
| 0.40 | 0.80 | 24.67 | 0.165 | 0.83 | 17.0 |
| 0.40 | 1.39 | 8.17 | 0.165 | 1.46 | 17.4 |
| 0.40 | 2.00 | 3.95 | 0.165 | 1.99 | 15.6 |
- Sketch the graph of the pendulum’s period squared against the inverse of the artificial-gravity value.
RESULTS:

- Discuss the results, draw conclusions, and suggest experimental improvements.
Results and discussion
The graph of the pendulum’s period squared versus the inverse of the artificial-gravity value is a straight line with a positive gradient, so students can conclude that the pendulum’s period squared is proportional to the inverse of the artificial-gravity value. If students already know the theory of a simple gravity pendulum, they can match the line’s gradient to the factor 4π2l. If they try to calculate the gradient and compare it with the factor 4π2l though, they might be a bit disappointed, since this theory is only applied to the simple pendulum, which is an ideal model of the physical pendulum.[4] Additionally, the motion of the pendulum in the described experimental setup is both rotational and translational, a theory more suitable for study by more advanced students.[5] Similar conclusions can be also extracted using the last column of the table, as it can be observed that the factor T2g is the same (to one significant figure), but, as mentioned above, this method is very sensitive to experimental errors.
If you are using this experimental setup as a study of an unknown natural phenomenon, things are much easier because, from the form of the sketched graph, students easily can draw the conclusion that
[pendulum’s period squared] = [gradient] × [inverse artificial gravity]
Other experimental setups can be used to facilitate the experimental study of more factors that affect the gradient.[6]
To guide the discussion, the following questions can be asked:
- Does the pendulum’s period change when gravity acceleration is increased?
- What is the exact dependence of the pendulum’s period on gravity acceleration?
- Did anybody compare the graph’s gradient with the factor T2g? Do they match and, if not, why? How do you compare the motion of a pendulum hanging from a hook with the motion of a pendulum on a rotating platform?
- Why is it important for the two points of rotation to differ? Could you draw the free-body diagram in such a case?
- Will there be an oscillation if the gravity acceleration tends to zero? What does the pendulum theory suggest? Can we use this setup to experimentally support the theory?
To help answer these questions, some FAQs about how gravity affects pendulums can be found in Ref. [7].
Summary
To my knowledge, this is the only experimental setup that can be used in a classroom to study period versus gravitational acceleration for a simple gravity pendulum. Other methods, apart from simulations, require large, expensive, and/or unattainable setups. The dependence is obvious through simple observation, and the results are superior to many obtained from computer simulations.
With this experimental setup, students can set a pendulum in motion and then record it with a mobile phone. From the videos that the students record, they can take measurements (the use of a video analysis application is recommended), observe how gravity affects the pendulum’s period, process the measurements, and draw conclusions or confirm the theory of a simple gravity pendulum’s period.
The processing of measurements is something that each teacher can decide to best serve their objectives, and this can be done individually, in groups, with a video analysis program, and so on.
Students can benefit from this activity because, apart from studying the theory of the gravitational pendulum, they have an excellent opportunity to understand how the scientific method is applied, develop their teamwork and leading skills, and practice data processing and analysis.
References
[1] A version of Christiaan Huygens’ Horologium Oscillatorium Part IV translated and annotated by Ian Bruce: http://www.17centurymaths.com/contents/huygens/horologiumpart4a.pdf
[2] The definition of artificial gravity: https://www.definitions.net/definition/artificial+gravity
[3] The definition of a pseudoforce: https://www.vedantu.com/physics/pseudo-force
[4] Five facts on the differences between simple and physical pendulums: https://lambdageeks.com/difference-between-simple-and-physical-pendulum/
[5] A detailed discussion on the physical pendulum: https://www.lehman.edu/faculty/anchordoqui/chapter24.pdf
[6] The simple pendulum experiment by J. E. Parks: http://www.phys.utk.edu/labs/simplependulum.pdf
[7] The effects of gravity on pendulums: https://bookvea.com/how-does-the-gravity-affect-the-period-of-a-pendulum/
Resources
- A video summarizing the activity.
- Learn about the laws governing the oscillation of simple pendulums.
- Explore pendulum motion using PhET virtual labs.
- Learn about the Coriolis Force.
- Read an article about fictitious forces.
- Read about how this effect could be used to create artificial gravity on space stations.
- Read an article about the PhET website and the use of virtual labs in science classes: Senapati S (2021) Virtual labs, real science. Science in School 52.
- Land an egg-naut safely on the moon and learn about classical mechanics along the way: ESA (2021) Landing on the Moon – planning and designing a lunar lander. Science in School 51.
- Challenge your students to explore the laws of mechanics through experiments with counterintuitive results: Tsakmaki P, Koumaras P (2017) When things don’t fall: the counter-intuitive physics of balanced forces. Science in School 39: 36–39.
- Use video analysis for a surprising mechanics experiment: Norrby M, Peltoniemi R (2016) Can something accelerate upwards while falling down? Science in School 37: 25–28.
- Learn about gravitational waves and where they come from: Arnaud N (2017) Gravitational waves: a taxonomy. Science in School 41: 13–18.