Moving pictures: teach speed, acceleration, and scale with photograph sequences Teach article
Author(s): Jon Tarrant
Picture sequences provide engaging opportunities for students to explore the concepts of speed and acceleration using supplied digital images or their own smartphones.
Calculating the speed of an object by recording the time taken to move a known distance can be done by using a stopwatch and a suitable tape measure, but this lacks an engaging hook. An alternative approach is to use picture sequences to make the analysis more concrete, which can be beneficial for students who are daunted by numbers. It also provides opportunities to work collaboratively with art, media, or ICT students on the application of digital photography.
Given that students need to be familiar with the speed–distance–time equation, it is still useful to start by using a stopwatch to time the passage of an object, such as a toy car, over a measured distance. Students should be encouraged to identify the challenges offered by the two measurements and should spot the fact that distance is generally easy to measure precisely, but the same cannot be said for time.
A different approach is to use digital photography. Three important advantages are:
The time interval between images is selected in the camera settings.
A distance or scale marker can be included in the pictures.
Once recorded, the picture sequence can be analyzed by different students, which allows opportunities for differentiation by age or ability.
Activity 1: Aircraft take-off speed
In this example, students use a picture-based approach to determine the take-off speed of an aircraft, where using a tape measure would be completely impractical. The activity is well suited to students aged 14–16 and is best done in small groups, with at least one student per group who is confident in calculations.
The activity takes up to 2 hours: the required analysis should be explained in one lesson and then set as a practical exercise in the next lesson. Asking students to recall prior information in this way is an effective technique for reinforcing learning. During the activity, the teacher can move around the classroom to offer support where needed.
Optional preparatory exercise: run through the stopwatch exercise described in the discussion section below.
To determine the distance moved by the aircraft in the take-off sequence, a vertical line is drawn through the same feature of the aircraft in the first and last pictures, as in figure 1.
The distance (on paper) between these two lines is then measured as accurately as possible. Students should be encouraged to repeat the distance measurement using different features on the aircraft, and to compare their results with other groups. If the results vary, ask how they should decide on the correct value. They might suggest using the modal value or the mean. If the mean is used, beware of values being quoted to an unjustifiable number of significant figures.
The time interval between frames is 0.33 s, so four frames contain three time intervals, which gives a total time of 1 s (3 x 0.33) for the sequence provided.
The speed of the aircraft, at the scale of the pictures, can be calculated by dividing the measured distance by the elapsed time. This is a good point to check the groups have all obtained similar values.
To convert the picture-scale speed into a real-life speed, students must find the scale factor. The first step is to measure (in millimetres) the length of the aircraft in the pictures. In real life, this aircraft has a length of 33.84 m,[1] which must be converted into millimetres. The true length of the aircraft is divided by the picture length to get the factor required.
The picture-scale speed of the aircraft (step 4) is then multiplied by the scale factor (step 5) to get the aircraft’s true speed in mm/s. This can be divided by 1000 to get a value in m/s.
Extension task: although m/s is the correct SI unit for speed, the speeds of large vehicles are commonly given in km/h, and students who are confident with numbers can convert their answers into this form.
Figure 1: Composite of aircraft take-off sequence for Airbus A319-100 Image credits: Jon Tarrant, CC-BY-SA
Discussion
Students can research the take-off speed of the type of aircraft shown in figure 1 (an Airbus A319-100) and should find there is a small discrepancy between the calculated speed and the specified value.[2] To explain why, students can look more closely at the details of aircraft take-off speeds, which commonly have three values for different stages of the operation. Given that the aircraft in the picture is already airborne, maybe the initial climb speed would be a better value for comparison? Another possible cause is a distorted image of the aircraft due to its movement. This is unlikely to be significant in this case, but it can be discussed with interested students using the photographic distortion infosheet.
Students may wonder if it is possible to check the time interval in the pictures, as a small error in this value would produce a significantly different result. One way to perform such a check is by using the same camera to photograph a mechanical stopwatch (figure 2). Digital stopwatches and smartphone timers may display multiple figures at once due to a slow refresh rate, but students can discover this issue for themselves.
Figure 2: Four-frame sequence captured with the same camera as that used for figure 1 Image credits: Jon Tarrant, CC-BY-SA
Optional extension
If there is a suitable public viewpoint at a nearby airport, students may want to record their own pictures. Best results are likely to be obtained using a digital stills camera. Smartphones can be used instead, but few offer a picture-sequence mode; the solution is to record a short video and then extract individual frames. Details are given in Teacher instruction sheet 1: Analysis of video recordings.
Activity 2: Maximum speed of a toy car
An electric toy car, as suggested in the introduction, can also be investigated photographically as a hands-on experiment. This can be done after Activity 1 or as a stand-alone activity. The initial stages are suitable for students aged from 11 years, but acceleration calculations are likely to be accessible only by students aged about 14 and older.
The activity can easily be extended to include energy transfer (see extension activities) and to provide advanced students (aged 16 years and above) with opportunities to consider the reliability (precision) and accuracy of results generated by different methods.
It is best to perform the practical and initial discussion (steps 1–8) in one lesson and to analyze the photographic results in the next.
Materials
Remote-control (RC) model car or slot-racing car and track
Straight-line course or track to measure
Metre rule(s)
Multiple stopwatches
Digital camera(s) or smartphone(s)
NOTE: Several students may want to do their own filming, which is a great sign of engagement, but it is strongly recommended to provide a digital stills camera that is known to yield a suitable level of image quality.
Procedure
Lesson 1
Ask students the best way to determine the maximum speed of the model car. They may suggest timing its travel over a measured distance and that some initial space should be provided to allow the car to reach full speed.
If Activity 1 is not done first, students may not suggest photographing/videoing the experiment. In this case, raise this option and discuss the advantages and the best angle from which filming should be done.
Divide students into groups of at least five.
Position the metre rule(s) and assign roles, which may be rotated if multiple runs are performed; car driver, several stopwatch users, camera/smartphone operator(s), and vehicle recovery.
Position the car at the suggested distance before the start of the measured course and prepare to film. The scale on the meter rule(s) must be clearly visible, and bright lighting will help ensure good images.
Camera operators should start their filming (or stills sequence) beforethe car enters the timed section and stop after the car has exited it to ensure at least two different positions on the course are recorded.
Document the times obtained by the multiple stopwatch users and optionally perform repeat runs.
Optional: show a video recording if one is available. The video can be repeated and the car can be retimed with stopwatches on each occasion. Are the times obtained more consistent than the live timings? If so, why might that be?
Lesson 2
Analyze the stopwatch data: what was the mean time and what was the range of times? If multiple runs were undertaken, to what extent did these values vary? Does the variance likely reflect a variation in the toy car’s performance or some other factor?
After extracting the required images, give students a printed sequence (see figures 3 and 4).
Tell students the time interval for successive pictures and discuss the most accurate way to mark the distance moved by the car between the images (see Activity 1). Students then work individually or in groups to calculate the car’s speed. This may be done as a single speed calculation using the first and last images, or it may be calculated for each time interval to check for acceleration.
Compare the overall speed obtained by the various methods. What is the likely true top speed of the model car? Is there any evidence of acceleration over multiple images? If so, can it be calculated?
Figure 3: The positions of the toy car in this sequence are such that only two frames are captured, even though the camera is recording images with an interval of just 0.11 s. Image credits: Jon Tarrant, CC-BY-SA
Figure 4: This is a repeat run for the toy car shown in figure 3, but, in this sequence, there are three usable frames, allowing acceleration to be investigated. Image credits: Jon Tarrant, CC-BY-SA
Extension activities
Instead of placing the car on the floor or a flat table, it is possible to use an inclined ramp and to investigate how the toy car’s speed (or acceleration) changes with the angle of the ramp. This is a challenging extension that allows students to explore the conservation of energy by comparing the car’s motion with its rate of gain of gravitational potential energy.
Provided that all due safety considerations are taken into account, Activity 2 can be scaled up in a playground or on a sports field to determine the speed of a student who is cycling or skateboarding along a straight line. A distance scale needs to be visible and might be provided by having students hold a long tape measure behind the course. Alternatively, the length of the vehicle being ridden can be used as a scale marker, as in Activity 1.
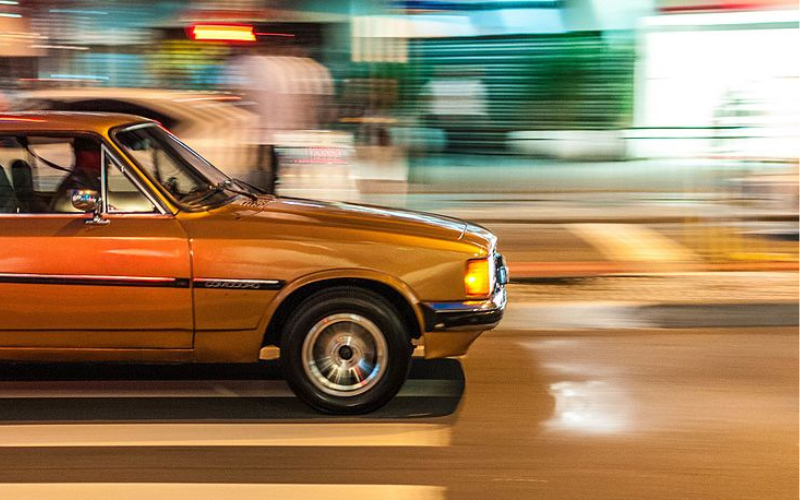
Another variation is to investigate the speed of full-size motor vehicles moving along a straight road that is edged with suitable distance markers, such as evenly spaced fence posts, as shown in figure 5. Details can be found in Teacher instruction sheet 2: How fast is that car moving?
Figure 5: Road car photographed at 0.2 s intervals in front of fence posts spaced 3.4 m apart. See the the supporting material for a full analysis Image credits: Jon Tarrant, CC-BY-SA
Use physics to work out what happens in a car crash and teach about road safety: Hargreaves J (2018) Look out! The physics of road safety. Science in School44: 34–39.
Explore data visualization by sketching graphs from ‘story’ videos of everyday events: Reuterswärd E (2022) Graphing stories. Science in School58.
Encourage your students to think like an engineer and design a glider wing: Holligan B (2015) High flyers: thinking like an engineer. Science in School34: 36–40.
Read an article about the PhET website and the use of virtual labs in science classes: Senapati S (2021) Virtual labs, real science. Science in School52.
Author(s)
Jon Tarrant is a physics teacher in Jersey and the creator of physbang.com. He was previously a photographer and photographic journalist and has written a number of books covering both film and digital photography. He is currently working on his first popular science book.
Review
This interesting and very nice article shows a new idea to teach the concept of speed using picture sequences. It also illustrates how students can create picture sequences themselves. The activities can be used not only in mechanics but also in art classes as it also provides insight into photography and filmmaking.
The article gives students the opportunity to ‘play’ with speed, scale and uncertainties in measurement., which helps to better understand these concepts. Some comprehension questions:
What scale is used in the picture sequence? Does it matter which scale you use? Explain your answer.
Theorem: The accuracy of the calculated average speed of an object increases as the time interval between successive pictures increases. Is this statement always true, sometimes true, or never true? Explain your answer.
You could also add the following assignment: create a sequence of five drawings to illustrate your drive from home to school
Annemiek van Leendert, math teacher, the Netherlands