Eurostat’s Education corner: your key to European statistics Inspire article
Author(s): Romina Brondino, Giorgia Macchia
Use the Education corner on the Eurostat website to bring real-life data to your class and teach your students about statistics.
Eurostat is the statistical office of the European Union and provides high-quality statistics and data on Europe.
Did you know that in the EU:
there are 5.2 million teachers employed in primary, lower secondary, and upper secondary education (ISCED levels 1-3);
among them, the majority (73%) are women, 27% are men;
the average number of pupils per teacher at primary, secondary, and upper secondary levels is 12.1;
out of 4.3 million graduates (ISCED levels 5-8), 21% graduated in science, mathematics, computing, engineering, manufacturing, and construction (STEM)
(2021 data)
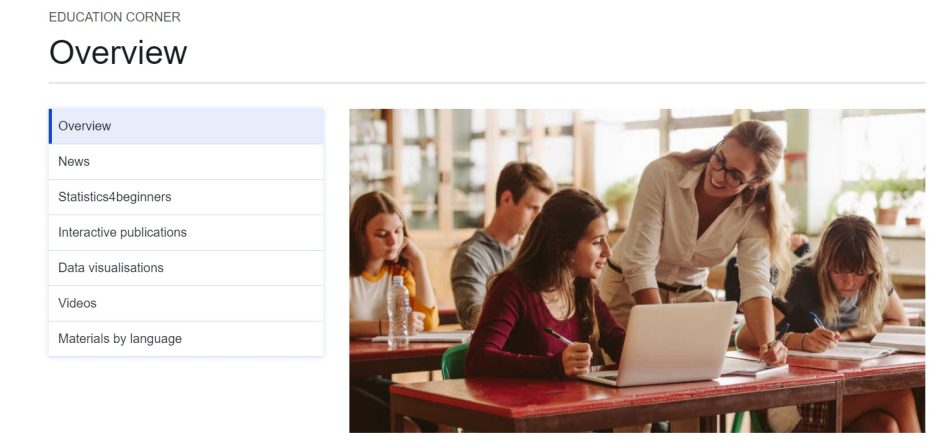
The Education Corner
With the spread of new technologies and sources of information, it is becoming more important for everyone to be able to understand data in media, on the internet, and elsewhere. Making official statistics easier to grasp is a key element of improving statistical literacy in society.
Eurostat has developed various resources to make the learning and understanding of statistics digestible for all levels.[1] Our Education corner is entirely dedicated to statistical literacy, with tools targeted at students, teachers, and anyone else wishing to learn more about the world of statistics. The tools are designed to be easy to grasp and interactive, and are intended to support teachers in the classroom. Some of these tools simply aim to improve the understanding of basic concepts, while others are more complex and take a deeper dive into data and fact-checking practice.
On Eurostat’s website and in the Education corner, teachers and learners can find a variety of resources, from explanatory articles on statistical concepts to interactive publications and tools that can provide data to all types of users.
Some of the materials are available in multiple languages under Materials by language. These materials, produced by national statistical offices and organized by language, can further support classroom activities.
Herein you will find an overview of the main resources available on Eurostat’s website, with some suggestions on how they can be used in classroom activities.
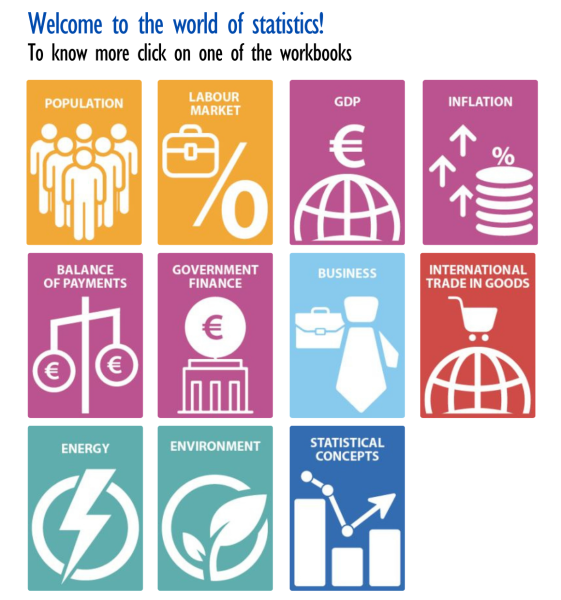
The Statistics 4 Beginners articles cover various topics, which are explained in layman’s terms to help the user grasp basic statistical concepts.
These articles are grouped under 11 different themes. They explain important topics, such as GDP and inflation, and describe in detail how statistical data are collected and what they mean. They can be used as teaching material or as support for activities and exercises in the classroom.
How do you get statistical information about the population? Looking at the article on population, students can lead a simplified survey simulation in the classroom.
How do we calculate inflation? Using the article on inflation, students could start monitoring prices of a group of goods. They would be encouraged to go grocery shopping with their parents and to record the prices of a specific list of goods during a period of time to see how they change over time.
The workbook on Statistical concepts also provides technical explanations of the tools and operations underlying statistics, which can be useful for mathematical exercises and the understanding of concepts, such as aggregate, mean, and median. Students of maths can benefit from the use of real-life data for different forms of calculations, from additions for aggregates to more complex equations to obtain rates and indices.
Interactive publications
Interactive publications provide a comprehensive overview of a specific topic, using simple language and short texts. They are designed to be intuitive and accessible.
Given the predominance of visual representations of data, they can support the development of skills for reading graphs. They can also be used in ’reverse classroom; methodology, asking students to deliver presentations around a single question/issue.
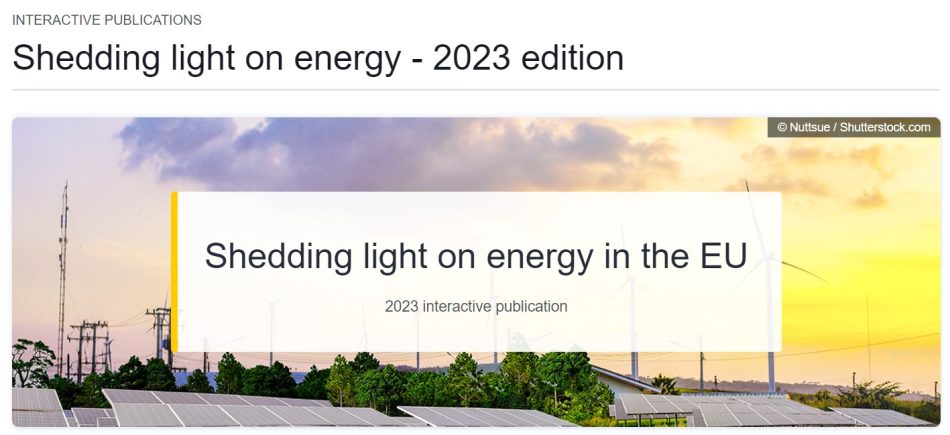
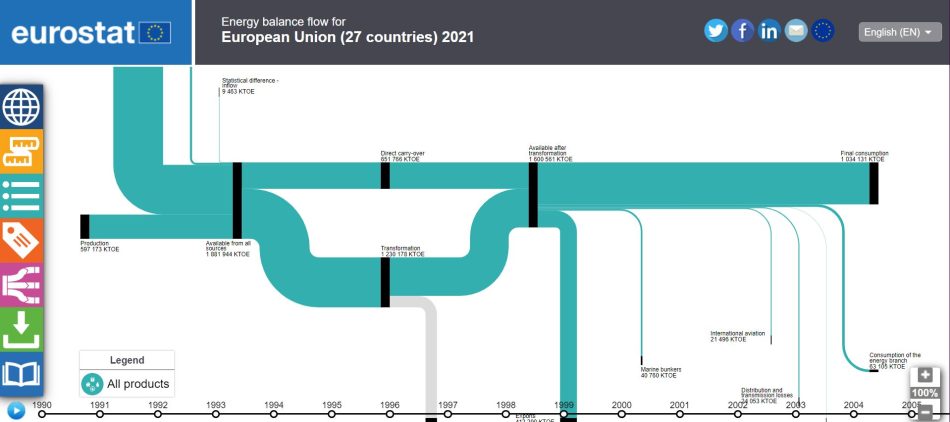
With the interactive publication Shedding light on energy in the EU, for example, students have access to an overview of this extremely important topic, and can make informed presentations on different aspects of energy production and consumption in the EU.
Data visualizations give quick visual access to the main indicators on a specific topic. Students can compare their country, region, or people of the same age on a wide range of topics. Compared with interactive publications, they focus less on explaining the indicators and more on checking data, giving more immediate access to them. These could be useful sources for class projects, presentations, or quizzes.
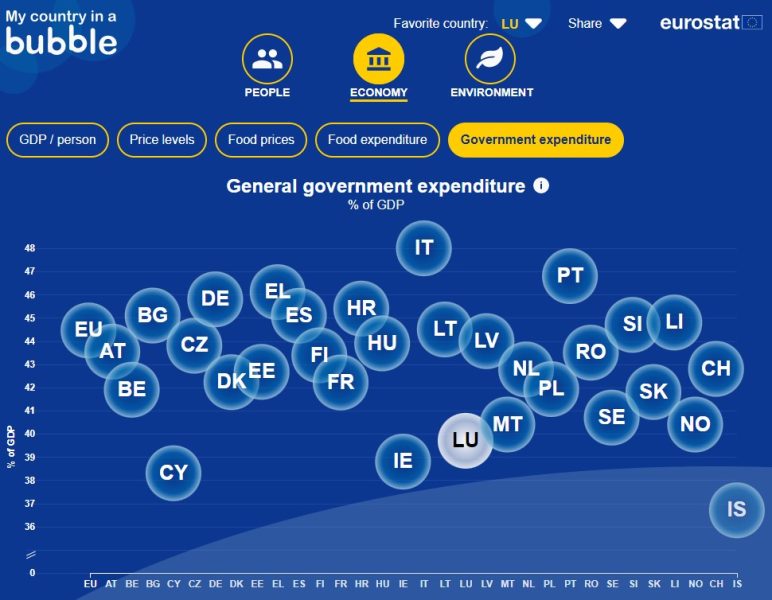
With My country in a bubble, students use roleplay to represent different countries, and must answer questions according to their country’s data records. The teacher reads a sentence or asks a question, then invites students to move to different areas of the classroom assigned as AGREE, NEITHER AGREE NOR DISAGREE, and DISAGREE.
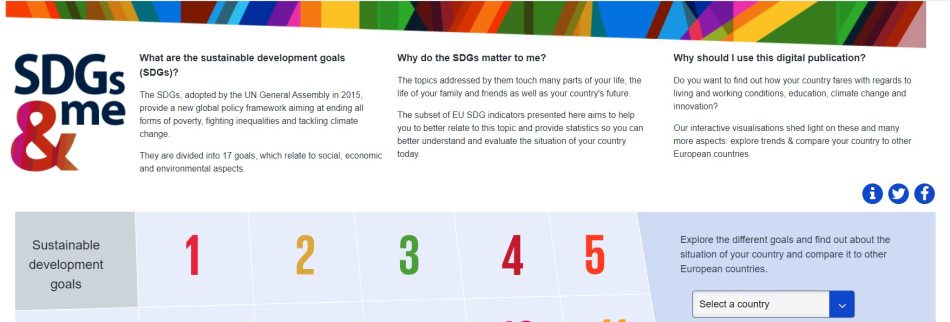
SDGs&me is an interactive tool designed to monitor progress in European countries on Sustainable Development Goals. This interactive data visualization is useful and could be used to complement and support other classroom activities on SDGs by introducing an interactive, engaging, and fact-based element to teaching.
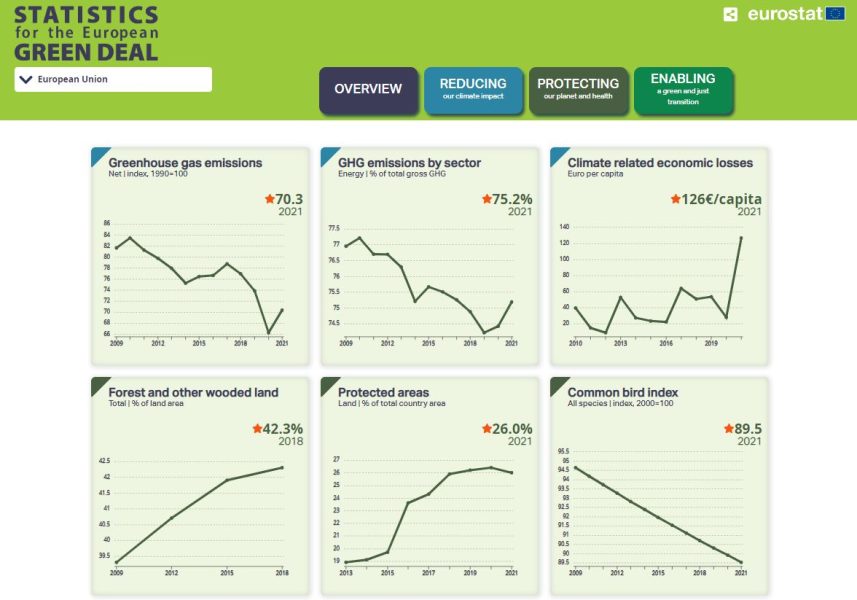
For studies on the environment and climate change, the Green Deal dashboard allows students to monitor emissions of greenhouse gases and the extension of forests and wooded land, allowing for the possibility to access detailed datasets to focus on specific geographical areas.
Videos, developed in the framework of the ‘Statistics in the classroom’ project, are another useful resource for teachers and provide explanations of various statistical concepts in English.
They are designed to support work in the classroom and are complemented by an exercise sheet that can be used with students to practice the topic presented. For example, students can watch an explanatory video on energy statistics and then work on the related learning material to find detailed data about energy on the Eurostat database.
Through Eurostat’s podcast series, Stats in a Wrap, students can listen to insights on how statistics are produced and to the latest developments in the related statistical field. They will be able to learn directly from the experts what happens behind the scenes of data production, practice their English listening skills, and have a handy tool to access some of the topics already taught in the classroom in a different format.
Students can have fun trying to answer the questions of the Eurostat Interactive quiz! At the same time, they learn about the data collected by Eurostat in an interactive and playful way.
Skills and competencies
All the materials mentioned can be adapted to suit different curricula, providing data and explanations that can be used both to dive into mathematical and statistical exercises, and to anchor data-driven sociological and environmental analysis and explanations for topical issues.
The European Statistics Competition
Want to take your statistical knowledge to the next level? Enter the European Statistics Competition!
For students who want to test their abilities in statistics, Eurostat, along with national statistical institutes, organize a competition.
It is run in two phases:
Participants initially register for the national phase, which is organized individually by country, and participants are required to pass some individual and group tests on statistics.
The winning teams of the national phase have the opportunity to participate in the European phase, in which they have to prepare a two-minute video and a document on a topic using official statistics. They should be able to demonstrate their ability to find data and effectively communicate their results.
The winners receive a monetary prize and teams ranked in the first five are also awarded prizes.
Further information on the European Statistical Competition and the national phase can be found on the ESC website, with links to national websites and the competition rules. Look at the winning videos from 2022/2023 contest and listen to interesting insights on the competition in Stats in a Wrap podcast, Episode no. 5.
Learn how to make statistical evaluations to measure plant growth: Brown J, Karamurzina S, Zharylgasin S (2020) Grow your own statistical data. Science in School50.