An ocean in the school lab: rising sea levels Teach article
Not just melting ice: a simple experiment demonstrates how thermal expansion contributes to rising sea levels as one of the consequences of climate change.

An expanding ocean
The planetary ocean is a mass of water that covers most of our planet and interconnects all parts of the globe. It plays an important role in the Earth’s climate and, although a complex system, still obeys the simple laws of physics and chemistry taught in schools. When teaching these laws, teachers can use this example to raise awareness of the dynamics of the ocean and its impact on our lives.
Thermal expansion and volumetric coefficient of thermal expansion
When talking about a rise in sea level due to global heating, many people think only of melting ice sheets and glaciers and do not realise that thermal expansion is actually a significant factor.
Most materials expand when heated. We say ‘most materials’ because water in the liquid state does not follow this trend between 0 and 4°C. Despite this behaviour, above 4°C, water will expand when heated. This is one of the problems with an increase in the sea-surface temperature – the water dilates and contributes to rising sea levels. Thermal expansion is responsible for about 43% of rising sea levels,[1] which pose a serious threat to populations living along coastlines.
Activity 1: Observing the thermal expansion of water
Students can see first-hand how water behaves with temperature. This simple experiment is suitable for students aged 11–14 and demonstrates how the volume of water changes with temperature. The activity lasts about 15 minutes.
Materials
- 250 cm3 Erlenmeyer flask
- Approx. 300 cm3 water containing food colouring
- Graduated pipette
- Laboratory rubber stopper
- 500 cm3 beaker
- 200 cm3 hot water, approx. 50oC
Procedure

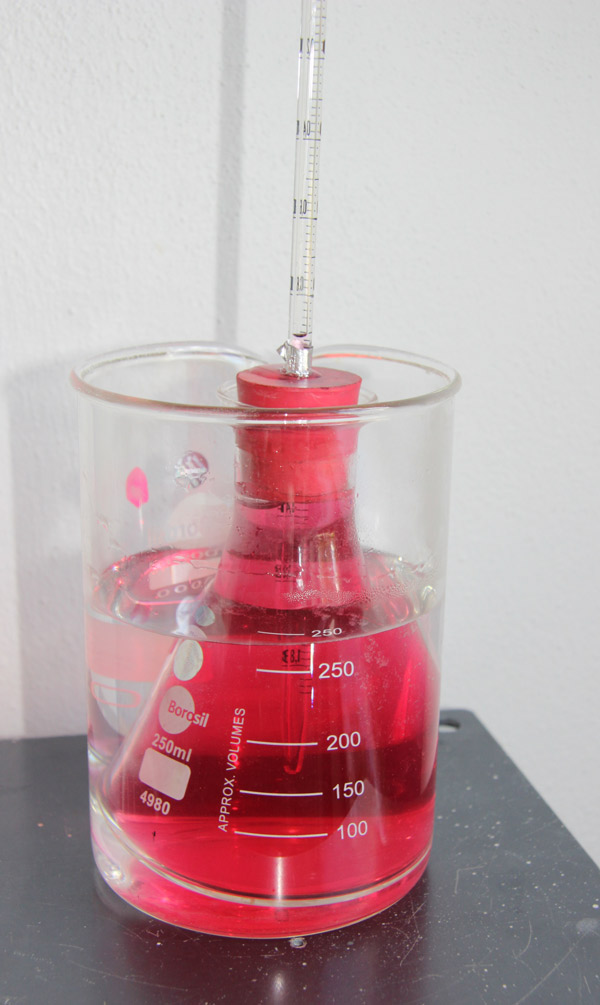
Image courtesy of Ole Ahlgren
- Make a hole through the stopper, so it can accommodate the graduated pipette.
- Fill the Erlenmeyer flask with water containing food colouring.
- Close the flask with the stopper and add more water until it can be observed on the scale of the pipette.
- Ask the students to note the water level (the volume of water is not important, but the reading will allow students to detect any changes).
- Immerse the flask inside a large container like a 500 cm3 beaker containing hot water, allow the water inside the flask to warm up until the expansion stops (this takes several minutes) and then ask students to make a note of the water level.
Activity 2: Measuring the thermal expansion coefficient of water
Older students can expand on Activity 1 to roughly calculate the thermal expansion coefficient of water. This physical quantity, in K-1, can be calculated using the following equation:
where ΔV is the variation (increase) in volume, V is the initial volume, and ΔT is the variation in temperature.
This is a rough calculation because, as proposed, the experiment contains several errors that are difficult to overcome, as we will explain below. However, if this is acknowledged and the main objective is not to determine an exact value for the coefficient of thermal expansion, but rather a value of the same order of magnitude as the actual one, students can still perform measurements and draw some conclusions.
One of the problems with this experiment is that the thermal expansion coefficient of water varies with temperature: for example, at 10°C it is 8.8×10⁻⁵ K-1, at 20°C it is 2.07×10⁻⁴ K-1, and at 30°C it is 3.03×10⁻⁴ K-1.[2] The value is also small; therefore, to allow a measurable variation in water volume, it is best to use a significant initial volume of water and a significant variation in temperature.
The activity is suitable for students aged 14–16 and lasts about 45 minutes.
Materials
- 250 cm3 Erlenmeyer flask
- Approx. 300 cm3 water containing food colouring
- Graduated pipette
- 500 cm3 Graduated cylinder
- Laboratory rubber stopper
- 500 cm3 beaker
- 200 cm3 hot water, approx. 50oC
- Thermometer
Procedure
- The process is the same as that in Activity 1, but some measurements have to be made.
- The water’s temperature is measured at the beginning of the experiment (Ti), when it is at room temperature, and at the end (Tf), so we can determine the temperature change (ΔT).
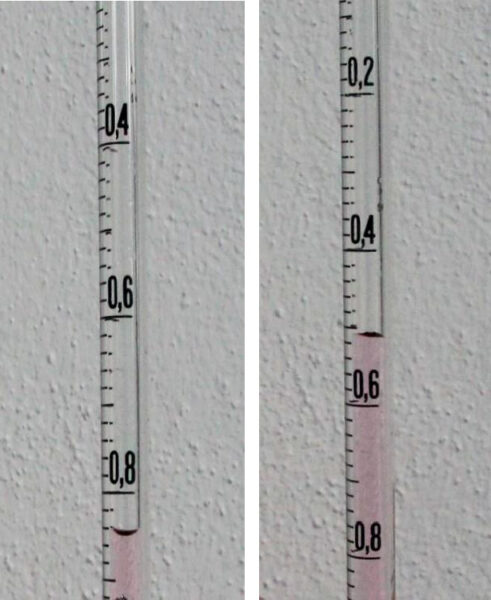
- The water level inside the graduated pipette is measured at the beginning and end of the experiment to calculate the volume change(ΔVpipette). The total volume of water, V, is measured using a graduated cylinder at the end of the experiment, after the water has cooled to room temperature again. This way displacement resulting from insertion of the stopper will not be measured.

Image courtesy of Ole Ahlgren
Results
In this experiment, we obtained the following values:
| Ti [°C] | Ti [K] | Tf [°C] | Tf [K] | ΔT [K] | ΔV [cm3] | V [cm3] |
| 21.2 | 294.3 | 30.4 | 303.5 | 9.2 | 0.52 | 298 |
Using equation (1), water’s coefficient of thermal expansion can be calculated:
Ask the students for possible sources of error.
As explained previously, the value is not exact and will probably be higher than the actual value for the range of temperature applied in the experiment, but it is still of the same order of magnitude.
Discussion
How can this value be translated into a rise in sea level? After all, the coefficient is very small, the water affected by the rise in temperature of the ocean is mainly that closer to the surface, and even this increase is small compared to the temperature change in the experiment. However, students should not be deceived by this; the ocean is massive, and even a small increase in temperature will cause an expansion of the ocean that contributes to rising sea levels.
Although the ocean does not have a homogeneous temperature, on average, a 700 m deep section of ocean has increased in temperature by 0.1°C from 1961 to 2003.[3] With some simplifications, it is possible to estimate the rise in sea level for the situation described.
Present the following problem to your students: let us assume that the ocean is a column with area A and height h, or volume V = A×h. How much will the water level rise, or the height of a 700 m column of water change, if water heats up by 0.1°C (0.1 K) and it can only expand vertically (in the direction of the height of the column)? Tell the students to assume that the value of αV they calculate is an acceptable approximation.
Using equation (1), students can do the following calculation:
As mentioned, this is a simplification. Thermal expansion is not linear with temperature, and the ocean also expands inland, with the rise in water level depending on the gradient of the coast. Nevertheless, the result highlights the point that this expansion is not negligible.
Conclusion
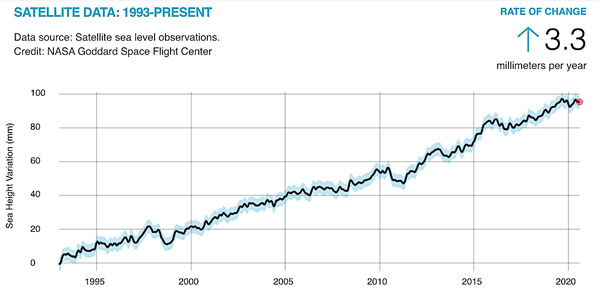
So, even a small increase in temperature of 0.1°C can translate into a significant rise in sea level. And this is only thermal expansion at play; the rise in temperature of the planet also causes melting of the ice sheets and glaciers, which contributes to the rise in sea levels. On average, and over the last 25 years, the sea level has been rising by about 3 mm a year, as determined from satellite data, and this rise is accelerating.[4]

©NASA’s Goddard Space Flight Center[5]
Questions to ask the students:
- Why does global heating lead to a rise in sea levels?
- How will populations living near the coasts be affected by a rise in sea level?
- With a constant rise of 3.3 mm a year, how much higher will the sea level be in the year 2100?
References
[1] ESA infographics on the causes of rising sea levels: https://www.esa.int/ESA_Multimedia/Images/2018/09/Causes_of_sea-level_rise
[2] An online calculator to determine volumetric temperature expansion: https://www.engineeringtoolbox.com/volumetric-temperature-expansion-d_315.html
[3] Silver J (2008) Global Warming and Climate Change Demystified, McGraw-Hill. ISBN: 0-07150-240-8
[4] A video from ESA on rising sea levels: https://www.esa.int/ESA_Multimedia/Videos/2018/09/Sea-level_rise/
[5] Satellite data on sea levels: https://climate.nasa.gov/vital-signs/sea-level/
Resources
- Read about the role of our oceans in climate change: Harrison T, Khan A, Shallcross D (2017) Climate change: why the oceans matter. Science in School 39:12–15.
- Find out about the physics at work beneath the waves with these classroom experiments: Watt S (2012) Movers and shakers: physics in the oceans. Science in School 25: 28–33.
- Explore other chemistry experiments relevant to climate change: Shallcross D, Harrison T (2008) Practical demonstrations to augment climate change lessons. Science in School 10:46–50.
- Read about the impact of human activity on climate change and its consequences for the Earth: Follows M (2019) Ten things that affect our climate. Science in School 47:19–25.
- Find out about some consequences of climate change that are already having an impact on many communities: Unwin H (2020) The social science of climate change. Science in School 49:18–22.
Review
Everyone thinks that with global heating, ocean levels will rise due to melting ice. This article highlights the connection between this heating and an old physical phenomenon, the liquid thermal expansion.
Corina Lavinia Toma, physics teacher, “T. Popoviciu” Computer Science High School, Romania


