Climate change modelling in the classroom Teach article
Why not get your students to make their own predictions of climate change – with the help of Dudley Shallcross and Tim Harrison from Bristol University, UK?
Climate change and global warming are ‘hot’ topics and deserve an important place in the school science curriculum. But how do we predict how our climate is going to change? It seems timely to introduce students to simple climate modelling. In this article, we demonstrate that students can use a straightforward spreadsheet to investigate the major factors that affect Earth’s climate.
A first attempt to model the climate
The simplest model of the climate is one in which incoming solar energy is equal to outgoing terrestrial energy emitted from the planet, i.e. an ‘energy in equals energy out’ model. In this article, the term ‘energy’ really means energy flux, i.e. energy per second. We know from measurements that the energy from the Sun reaching the top of the atmosphere (per second), termed the solar constant S, is 1370 Wm-2.
We start by calculating the average surface temperature of Earth, TE. If we take the radius of a perfectly spherical Earth to be RE, in this very simple model we can see that Earth absorbs solar radiation over an area πRE2 (i.e. a flat disc of atmosphere) but emits energy from an area 4πRE2 (i.e. from the entire surface).
(a) Energy in = energy out
and using the Stefan-Boltzmann Law (see box)
(b) Energy per unit area per unit time x total area(disc) = energy per unit area per unit time x total area(sphere)
(c) 1370 x πRE2 = σTE4 x 4πRE2
Rearranging the equations gives:
σTE4 = 1370/4 = S/4
TE4 = 1370 / (4 x 5.67 x 10-8)
TE = 279 K (6°C)
where σ is the Stefan-Boltzmann constant (5.67 x 10⁻⁸ Wm-2K-4).
At first glance, this looks like a sensible figure for such a crude model, although of course the actual average surface temperature of Earth is known to be 16 °C. (There are several ways to work it out, such as by splitting Earth into latitude bands, working out the average temperature per band and summing and averaging all of these.) The problem with this very simple model, though, is that some solar energy is not absorbed by Earth, but is instead reflected back out to space by clouds and ice.
Approximately 24% of the incoming energy is reflected by clouds and another 6% is reflected by the surface, e.g. by ice. This gives a total reflectivity of Earth – known as the albedo (A) – of 30% or 0.3. Therefore, the left-hand side of equation (c) must now be re-written as 0.7 x 1370 x πRE2 and the calculation of TE becomes:
TE4 = (1370 x 0.7) / (4 x 5.67 x 10-8)
TE = 255 K (-18°C)
This value is obviously far too low, and leads naturally to the question: why is Earth so warm? In order to answer this question we need a slightly more complex model.
Essential background physics
Black body radiation and the Stefan-Boltzmann Law
All bodies radiate energy as electromagnetic radiation. A black body absorbs all radiation falling on it. It emits radiation as a function of its surface temperature.
The Stefan-Boltzmann Law describes the total energy, I, emitted by a black body at any temperature, T, by:
I(T) = σT4 (Equation 1)
where:
I is the energy per unit area emitted per second (Wm-2)
T is the absolute temperature (K)
σ is the Stefan-Boltzmann constant (5.67 x 10⁻⁸ Wm-2K-4).
The one-layer atmosphere model of Earth
If we assume that the atmosphere is made up of a single layer of miscible gases, we can create a more accurate model that students can use with a spreadsheet. In this model, allowances are made for absorption by the atmosphere of the incoming visible light from the Sun and absorption of the outgoing infra-red light emitted from Earth.
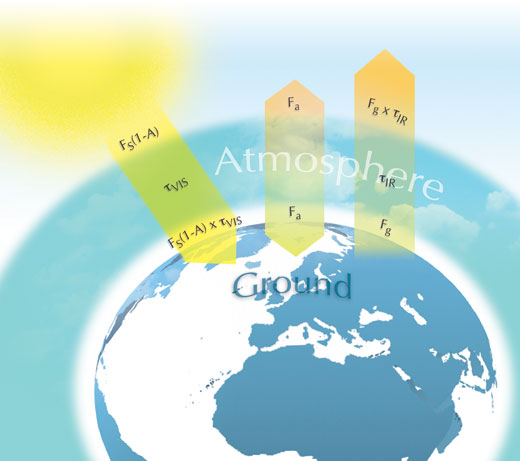
The figure below summarises the elements of the model. FS is the solar constant divided by 4 (S/4), which arises from the difference between incoming energy spread over a disc, πr2, and outgoing energy radiated from the surface of a sphere, 4πr2 (the assumption made in the first model). The incoming energy from the Sun is then FS(1-A), where A is the albedo – the portion reflected back to space. This incoming energy is in the UV and visible regions. τVIS is the proportion of this incoming energy that is not absorbed by the atmosphere: if the atmosphere absorbs it all, τVIS is zero; if the atmosphere absorbs none of it, τVIS is one. Hence the energy reaching the surface of the planet is FS(1-A) x τVIS.
Earth will behave similarly to a black body and will emit the energy denoted as Fg from its surface. This terrestrial radiation is centred in the infra-red region of the spectrum. Certain gases in the atmosphere absorb the infra-red energy (greenhouse gases). Similar to τVIS, τIR is the proportion of infra-red energy not absorbed by these gases in the atmosphere, and so the outgoing energy is Fg x τIR.
Assuming that the energy from the atmosphere is denoted as Fa and that energy in and out at the surface of Earth and the top of the atmosphere are both balanced, then:
at the surface of Earth:
FS(1-A) x τVIS + Fa = Fg (Equation 2)
and at the top of the atmosphere:
Fg x τIR + Fa = FS(1-A) (Equation 3)
Combining Equations 2 and 3 gives:
Fg = (FS(1-A)(1 + τVIS)) / (1 + τIR)
Finally,
Fg = σTE4 = (FS(1-A)(1 + τVIS)) / (1 + tIR)
TE = [(FS(1-A)(1 + τVIS)) / ( σ(1 + τIR))]0.25 (Equation 4)
If we take the following values:
FS = 1370/4 = 342.5 Wm-2 (solar constant divided by 4)
A = 0.3
τVIS = 0.8
τIR = 0.1
Equation 4 gives us:
TE = 288.5 K (15.5°C),
which is a close approximation to the current average surface temperature of Earth.

It is Equation 4 that can be put into a programme such as Microsoft Excel so that students can see the changes in global temperature when the equation parameters are changed. This has been done and an interactive version can be used online or downloaded from the Bristol University websitew1.
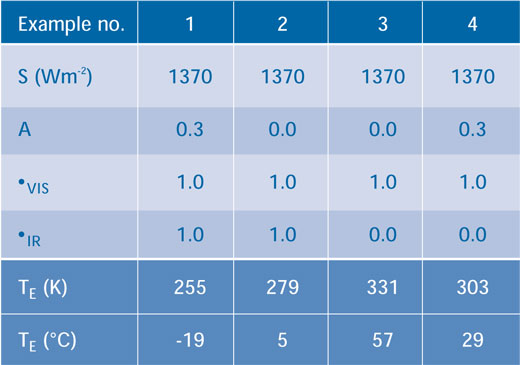
Table 1 shows examples of the output if the variables A, τVIS and τIR are altered. In Example 1 we assume that the atmosphere does not absorb any of the incoming or outgoing energy fluxes (i.e. both τVIS and τIR are equal to 1.0) and the albedo is 0.3, giving a temperature of 255 K. In Example 2, we assume that there are no clouds or ice (i.e. A = 0.0), which raises the temperature of Earth to 279 K, showing the importance of the albedo. In Example 3, there are also no clouds or ice (A = 0.0) but the atmosphere now absorbs all the outgoing infra-red radiation (i.e. τIR = 0.0) and Earth warms to 331 K. If we now reintroduce clouds and ice in Example 4 (A = 0.3), the temperature drops to 303 K.

Possible questions
Typical questions that could be asked, and which would require students to use this model, are:
- Which of the variables has the greatest effect on average global temperature?
- If the average distance from Earth to the Sun was increased by 1% of the current value, the solar constant would be reduced by a factor of 1.0201, i.e. it would become 1343 Wm-2. What would the temperature be? Assume an albedo of 0.3, τIR of 0.3 and τVIS of 0.6.
(The solar constant will scale with distance squared, so moving Earth 10% closer to the Sun will mean S = 1370/(0.9)2 = 1691 Wm-2 and moving Earth 1% further away will mean S = 1370/(1.01)2 = 1343 Wm-2)
Of course, far more challenging questions could be asked.
- If the sand in the Sahara desert could be made into a glass mirror (sand can be melted into glass),
- How big would the mirror have to be in order to cool the planet by 1°C?
- What fraction of the Sahara desert would that be?
A more sophisticated model

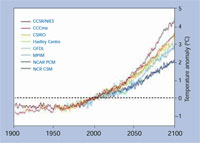
Climate model predictions for
global warming relative to
average global temperature in
2000. The model data used was
taken from the Intergovernmental
Panel on Climate Change Data
Distribution Centre.
Click to enlarge image
Image courtesy of Robert A. Rohde;
image source: Wikimedia Commons

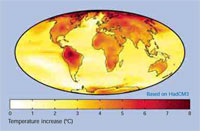
2070-2100 prediction vs.
1960-1990 average. A map of
predicted global warming at the
end of the 21st century.
This model has an average
warming of 3.0°C and uses the
Hadley Centre HadCM3 climate
model. Click to enlarge image
Image courtesy of Robert A. Rohde;
image source: Wikimedia Commons
How does the simple model compare with more sophisticated models such as the Hadley Centre climate model used by the UK’s Meteorological Office (see images below)? In fact, the two models are very similar, except that the Hadley Centre model does not consider the atmosphere as one layer, but splits it into a number of boxes based on altitude, latitude and longitude. For each box, the model directly calculates the amount of incoming UV/visible radiation transmitted and scattered within that box, and the amount of outgoing infra-red radiation transmitted by that box, based on the concentrations of key greenhouse gases and the surface area of cloud and ice. The most sophisticated versions of the Hadley Centre model also consider the heat flux into and out of the ocean and the uptake of CO2 by vegetation. But if you understand the principles of the simple model, you are well on your way to understanding the more complicated real climate models.
Taking part in a real climate simulation
Climateprediction.netw2 is the largest experiment to try and produce a forecast of the climate for the 21st century. It does this by recruiting help from people around the world who can offer time on their computers – such as when the computers are switched on, but are not being used to their full capacity. The full climate model has many parameters that can be adjusted; to explore all of these parameters, a phenomenal number of simulations must be performed. Even with the computer resources available to the climateprediction.net team, such an ensemble of simulations would take a very long time. The idea behind climateprediction.net is that anyone can download a version of the model that will explore one of these particular parameters (preset). The model will take about three months to run in the background while you work, without compromising the speed of the computer.
Calculations are performed in three parts. The first part runs calculations using data from the years 1850 to 1900, checking the resulting predictions against temperature records: this is known as the calibration run. The second part runs a simulation from 1901 to the present day. The third stage then runs a simulation of the future climate (2000-2100) with one parameter changed, for example the sensitivity of climate to uncertainties in the sulphur cycle. Once the calculations are complete, the data is automatically uploaded to the UK’s Meteorology Office the next time that the computer is online. The interface software provided (free of charge) with the simulation gives the computer user a graph of the changes to the climate, as they are calculated. Temperature variations by season with latitude, longitude and altitude are just some of the variables that can be visualised. Such features would enable a cross-curricular school project linking geography and the physical sciences.
In the next issue of Science in School, the authors suggest some chemistry experiments relevant to climate change.
Web References
- w1 – An interactive version of the simple climate model can be used online or downloaded here: www.chemlabs.bris.ac.uk/outreach/resources/simple_climate_model/index.html
- Use the sliders to change the variables.
- w2 – For more details about the experiment and how to get involved, see http://climateprediction.net.
Resources
- Harrison T, Shallcross D, Henshaw S (2006) Detecting CO2 – the hunt for greenhouse-gas emissions. Chemistry Review 15: 27-30
- Pacala S, Socolow R (2004) Stabilisation wedges: solving the climate problem for the next 50 years with current technologies. Science 305: 968-972. doi: 10.1126/science.1100103
- Shallcross D (2006) Dirty Air. Education in Chemistry, 43 (5): 131-135
- Numerous notes for schoolteachers on air pollution, climate change and ozone depletion by the authors can be found here: www.chemlabs.bristol.ac.uk/outreach/resources/Atmos.html
- For an excellent source of graphics and data relating to climate change, see: www.grida.no/climate/vital/index.htm
- Data from the Earth System Research Laboratory Global Monitoring Station can be found here: www.cmdl.noaa.gov
- The website of the Intergovernmental Panel on Climate Change, from which the Climate Change 2007 report and other data may be located, is: www.ipcc.ch
- Haubold B (2008) An Inconvenient Truth. Science in School 9: 72.
Review
Climate change should certainly be one of the topics of today’s science teaching at all school levels throughout Europe. In particular after Al Gore’s enormous Inconvenient Truth campaign, the topic has gained world-wide recognition. However, useful materials with usable background information for science teachers are not always readily available. This two-part article, however, offers a suitable and easy-to-adapt approach to the rather complicated process of modelling atmospheric developments.
Whereas the mathematical model is best suited for use in advanced science courses for students aged 16 and over, the basic phenomena could easily be presented to students at the age of 15 or even younger – even if they are not intending to specialise in science in later school years. The web resources mentioned offer a wide range of approaches and ready-to-use images, applets and graphs, thus providing a very useful resource for any science teacher.
Tobias Kirschbaum, Germany


