Ebola in numbers: using mathematics to tackle epidemics Understand article
Discovering how infectious diseases spread may seem purely a matter for medical science – but taking a close look at the numbers can also tell us a great deal.
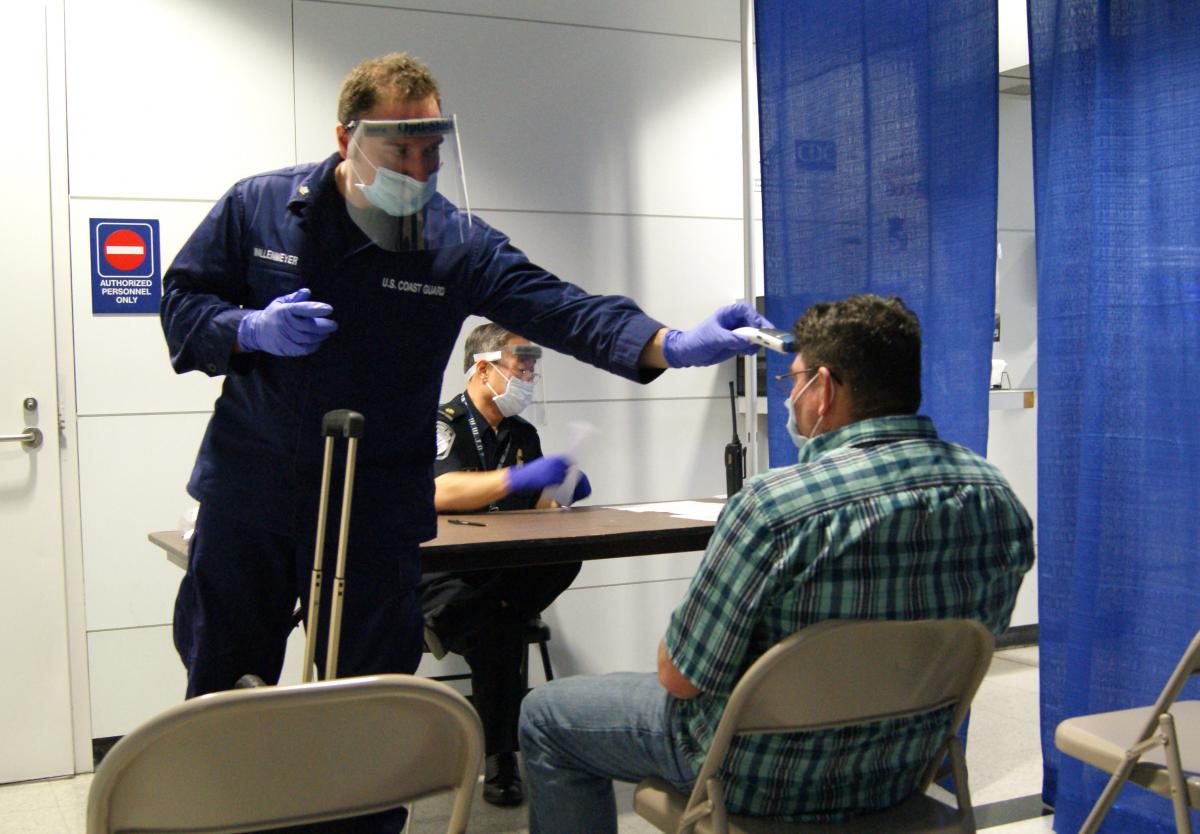
During the recent Ebola epidemic in West Africa, airports in the USA, UK and several other European countries started screening travellers arriving from high-risk countries for Ebola symptoms, including an elevated body temperature. This probably seemed like a sensible precaution – but a recent study, based on applying simple calculations to known facts about the disease, shows that it was never likely to be effective.

they arrive by aeroplane is
unlikely to prevent the
spread of Ebola.
Image courtesy of KlausF;
image source: Wikimedia
Commons
The study, published in the British Medical Journal (Mabey et al, 2014), found that ‘an entrance screening policy will have no meaningful effect on the risk of importing Ebola into the UK’. The authors’ argument is straightforward: assuming that anyone already showing Ebola symptoms is prevented from boarding an aeroplane, then to be detected by airport screening on arrival, a passenger must have developed symptoms on the flight itself. Because the average time between exposure to the virus and becoming symptomatic is quite long (around a week), the chance of an infected person being identified in this way is very low – no more than 13% at best. Since airport screening is costly, the authors suggest the money would be better spent in West Africa itself, helping to prevent a humanitarian crisis of ‘frightening proportions’.
Basic maths
A lot can be revealed using just basic mathematics – but care is always needed in deciding which figures to use. Early on in the Ebola outbreak, the death rate was thought to be around 50% – a figure calculated by dividing the number of deaths by the number of reported cases. But this ignored the fact that the outcome for people who were ill was not yet clear: they were counted as alive, even though some of them would go on to die, which led to an underestimate of the real death rate.

Sierra Leone being screened
for Ebola at Chicago’s O’Hare
airport.
Image courtesy of Melissa
Maraj, US Customs and Border
Protection; image source:
Wikimedia Commons
“This mistake happened a lot, and [the 50% figure] was widely reported,” says Adam Kucharski of the UK’s London School of Hygiene and Tropical Medicine, a colleague of the authors of the airport screening study. “In a very simple analysis, my colleagues and I tried to adjust the estimate. We found the death rate is probably around 70%, which subsequent clinical studies have lined up with.”
One hugely important figure at the start of an epidemic is the basic reproduction number, usually denoted by R0. This number measures the average number of people that one infectious person goes on to infect, assuming that no-one in the population is immune to the disease. For Ebola, R0 was estimated at the start of the outbreak to be between 1.5 and 2, which is similar to the number for pandemic flu. Measles, an airborne and highly infectious disease, has an R0 of around 18.
Again, some basic maths helps to give a rough idea of how quickly a disease might spread. If a disease has an R0 of 2 and the average infectious person passes the disease on within two weeks of contracting it (which is a realistic estimate for Ebola), in two weeks an infected person infects two others, who together go on to infect four others in the next two weeks, and so on. This is exponential growth, which increases very rapidly: after just 20 weeks, the disease will have infected:
1 + 2 + 4 + 8 + … + 210 = 2047 people
This model is over-simplified, of course. Although exponential growth is often seen at the start of epidemics, epidemiologists actually use more sophisticated models to predict the spread of diseases (see Keeling, 2001, and Kucharski, 2011). However, we can easily see the importance of R0: the same calculation for measles has the entire world population infected within just 16 days.
R0 is only an average value across the whole population, however, so the next thing to understand is how this number varies. For example, a recent study (Yamin et al, 2015) suggests that people with Ebola become more infectious in the later stages of the disease, so placing people in isolation during these later stages – and even after death, when the body is being prepared for the funeral – should have a greater effect than targeting them earlier.
Chance and uncertainty
Of course, chance is a major player – especially at the beginning of an outbreak. The first person to fall sick in Sierra Leone, where several thousand people died, happened to be a traditional healer, whose funeral attracted a large crowd. The people who touched the infectious body then took the disease with them as they travelled to other places.

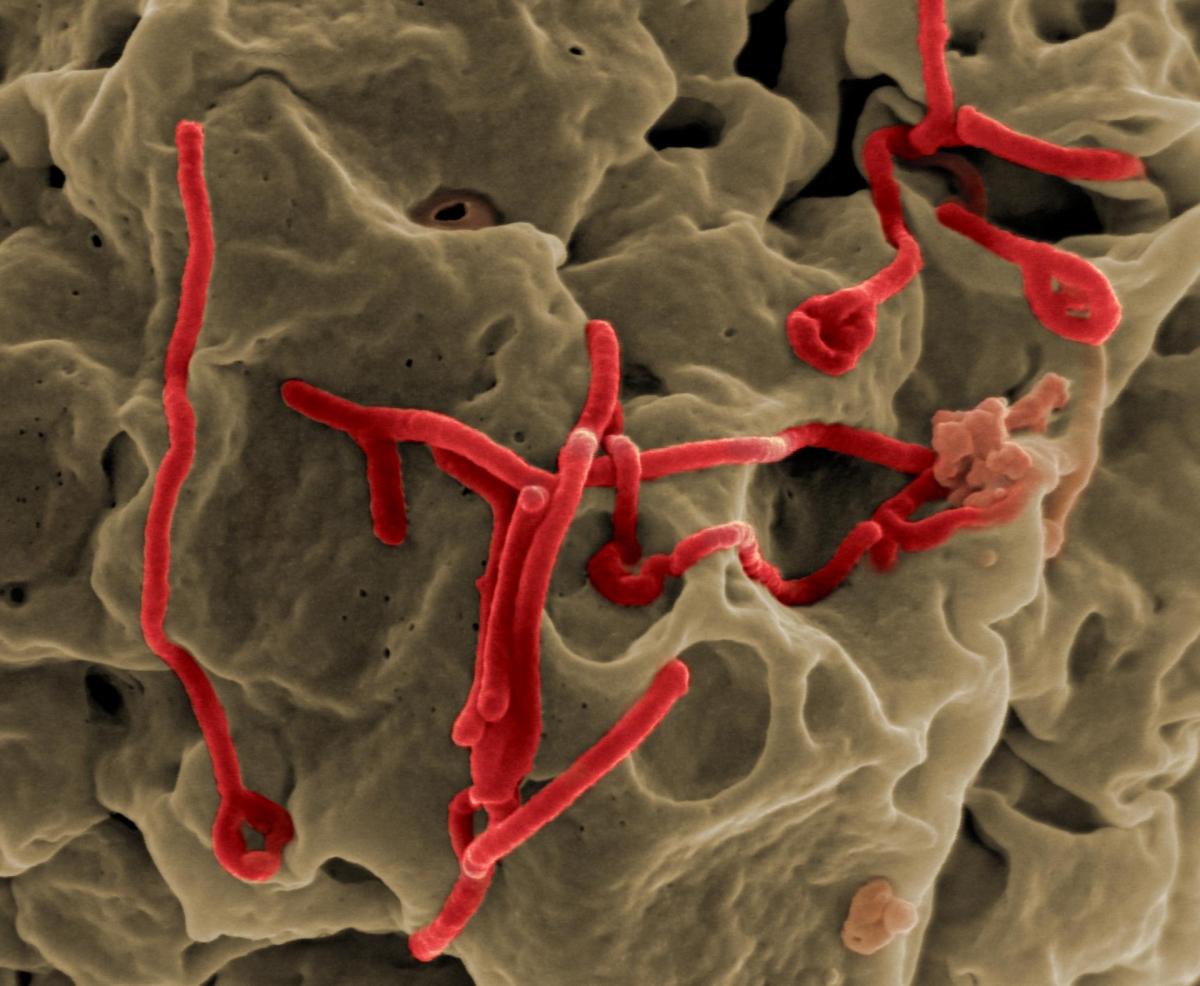
virus budding from the
surface of a cell.
Image courtesy of the National
Institute of Allergy and
Infectious Diseases (NIH);
image source: Flickr
“In situations where there are very small numbers, all it takes is one event and you could have a very different outbreak,” says Adam. Again, the basic reproduction number, R0, is an important factor in what’s likely to happen. The chance that a disease outbreak will turn into a large epidemic can be calculated as 1–1/R0 (see Kucharski, 2011). With an R0 of between 1.5 and 2 for Ebola, that chance works out at between ⅓and ½ – that is, between 33% and 50%. So with the recent outbreak, we’ve been a little unlucky.
There are other sources of uncertainty when it comes to predicting the course of a disease or the impact of interventions. Something may be missing from the model, or an initial uncertainty in an important parameter, such as R0, might grow as the model simulates events further into the future. Known as the butterfly effect, this is the reason why many phenomena, such as the weather or the stock market, are so hard to predict.
So how can we deal with such uncertainty? “I think that modellers sometimes need to be humble and say that they can’t forecast this far into the future,” says Adam. “People like to have a definite number; journalists especially are keen to report them. But as with any kind of forecasting, publishing just a single number is a dangerous thing to do.”
Sometimes, though, the results of a study are pretty convincing, even when there’s inherent uncertainty – the study into the effectiveness of airport screening, for example. “Introducing those screening measures was very much a political, rather than a scientific, decision,” concludes Adam. We can all be led by our fears when we are frightened, but the predictions of carefully calibrated, evidence-based mathematical models are probably a better guide to action.
More about Ebola
- Ebola is a severe and often fatal illness in humans.
- The virus is transmitted to humans from wild animals; once in the human population it spreads from person to person.
- The first known outbreaks of Ebola occurred in remote villages in central Africa, close to tropical rainforests. The most recent outbreak in West Africa, however, has involved major urban as well as rural areas.
- Survival can be improved by early supportive care with rehydration and symptomatic treatment. So far there are no licensed treatments for Ebola, but a range of blood, immunological and drug therapies are being developed.
- As yet, there are no licensed Ebola vaccines although two potential candidates are being evaluated.
Source: The World Health Organization, April 2015
Acknowledgement
This article was originally published in a longer form in Plus magazinew1, a free online magazine that opens a door to the world of mathematics with all its beauty and applications.
References
- Keeling M (2001) The mathematics of diseases. Plus Magazine.
- Kucharski A (2011) Keeping track of immunity. Plus Magazine.
- Mabey D, Flasche S, Edmunds WJ (2014) Airport screening for Ebola. British Medical Journal 349: g6202. doi: 10.1136/bmj.g6202
- Yamin D et al (2015) Effect of Ebola progression on transmission and control in Liberia. Annals of Internal Medicine 162(1): 11–17. doi: 10.7326/M14-2255. This article can be downloaded free of charge from the journal website, www.annals.org
Web References
- w1 – The original article, published in Plus Magazine, is available free online.
Resources
- To learn more about Ebola, see:
- The World Health Organization’s factsheet
- Kucharski AJ, Piot P (2014) Containing Ebola virus infection in West Africa. Eurosurveillance 19(36): pii=20899. This article can be downloaded free of charge from the journal website, www.eurosurveillance.org
- You can now join the fight against Ebola by downloading a free app and donating your spare computing power to the Outsmart Ebola Together computing project. The idea is to form a virtual supercomputer, made up of the donated computing power of (hopefully) tens of thousands of volunteers, which will screen millions of molecules that might be used to disable the virus. The best candidate molecules can then be tested physically in the lab and perhaps modified to perform better, and may ultimately lead to anti-viral drugs.
- Visit the Plus Magazine website for a classroom activity exploring basic epidemiological models. It uses basic probability and can be used to discuss exponential growth and geometric progressions.
- To learn more about the spread of infectious diseases, see:
- Bos K (2014) Tales from a plague pit. Science in School 28: 7–11.
- Heymann J (2013) Evolving threats: investigating new zoonotic infections. Science in School 27: 12-16.
- Niekoop L, Rienks F (2006) The ecologist’s view of bird flu. Science in School 3: 24–30.
- Quammen D (2012) Where will the next pandemic come from? and how can we stop it? Popular Science.
Review
Teaching probability and statistics is not easy; one of the main reasons is the difficulty in finding interesting examples that are relevant to students’ lives. This article is therefore a useful resource: Ebola has been in the news for months, and many people, even quite young school students, are worried about the risks.
The main value of this article is to provide a strong link between the life sciences and maths. It offers an example of how important reliable data are for medicine and public health, including how the data are collected, processed and presented. Interpretation errors are also covered in the article, which could lead to a discussion about how statistics can be properly or improperly used.
Many interdisciplinary activities could be based on the article, such as those involving life sciences, probability and statistics, history, economics and geography. The article could also be used as a basis for covering topics such as population dynamics and the effect of modern travel; disease transmission; public spending on health and welfare; links between diseases and economics; data journalism, a method of reporting on events and facts based on big number analysis; and how to read and criticise an article based on statistics. Finally, the article can be used to introduce modelling, a fundamental concept in science, and how it is based on data, or conversely how data are fitted into the model.
Comprehension and extension questions could include:
- What is meant by ‘high-risk countries’? List some high-risk countries for Ebola.
- How long is the average time between exposure to the Ebola virus and becoming symptomatic?
- What is the ‘reproduction number’ and why is it important?
- What is ‘exponential growth’?
Marco Nicolini, Liceo Scientifico Statale Alessandro Tassoni, Modena, Italy


