Hands-on seismology: constructing a school seismometer Teach article

This activity was presented at the Science on Stage Festival 2022Science on Stage logo

Build a simple yet sensitive school seismometer for a hands-on exploration of seismology.

When an earthquake occurs, part of the released energy is sent out as seismic waves, which are classified into two types: body waves that penetrate the Earth and surface waves that travel along the surface of the Earth.

Body waves are composed of two types: primary (P) and secondary (S). P waves are compressional waves. They are the fastest-travelling seismic waves, and they shake the ground in the direction along which they travel. S waves are transverse waves; they travel more slowly and shake the ground perpendicularly to the direction of propagation.

Seismograph showing S-wave and P-wave
A seismograph showing the S-wave and P-wave

Surface waves travel more slowly than body waves. They shake the ground in more complex ways and are the most destructive.

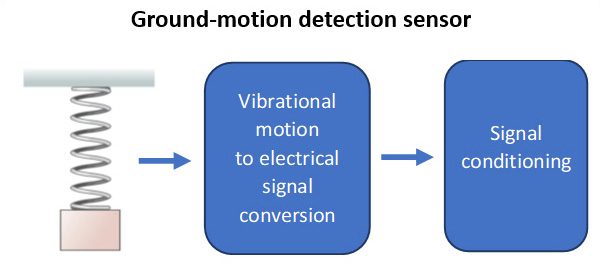
Seismometers are ground-motion detector sensors. Coupled with an appropriate recording system, they can be used to detect and measure seismic waves.

Building a simple yet sensitive school seismometer is not a prohibitively demanding task, and it does not require expensive or difficult-to-find materials. However, it does take some time and requires clear instructions. A booklet with more detailed instructions for building and adjusting the seismometer is included in the supporting information.

This article focuses on the educational construction of a seismometer and its use to analyse the recorded seismic data. With a cross-curricular project like this, students can

  • learn the basics concerning the creation of earthquakes and the propagation of and differences between different types of seismic waves;
  • recognize and understand the scientific principles behind the operation of a seismometer;
  • carry out experiments to adjust the device;
  • work like a real seismologist, determining, for example, the epicentre of recorded earthquakes.

The structure of a simple seismometer

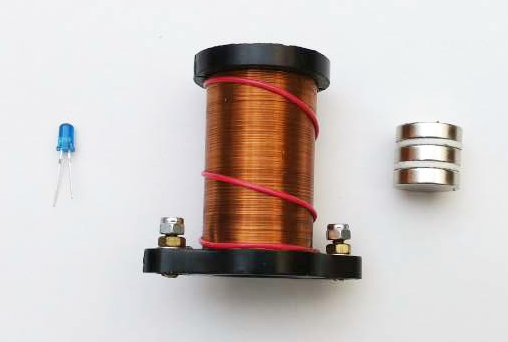
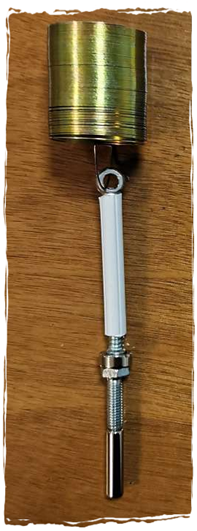
The ground-motion detection sensor consists of the following:

  • A ‘mass–spring’ system, which is forced to oscillate by the arriving seismic waves.
  • A system to convert the mechanical motion of the mass–spring system into an electrical signal. This is just a strong magnet and a coil, and its operation is based on the electromagnetic induction phenomenon.
  • The ‘signal-conditioning system’ consists of two subsystems. The first is the ‘electromagnetic braking system’. This is a neodymium magnetic disk freely moving inside a copper pipe. The magnet is attached to the mass–spring system and follows its motion. Due to eddy currents induced in the pipe, the motion of the mass–spring system is minimized quickly, resulting in the clear recording of the arrival of the S waves. The second subsystem is the ‘amplifier’,[1] which is needed because the electrical signal from the coil is very weak.
Ground motion detection sensor scheme: 1) Spring, 2) Vibrational motion to electrical signal conversion, 3) Signal conditioning
Image courtesy of Vasilis (Bill) Nousis

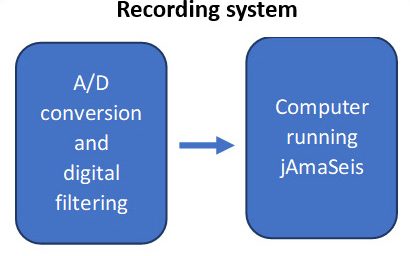
The recording system consists of the following:

  • An analogue (A) to digital (D) conversion and digital-filtering system, which is composed of an Arduino device running the NERDaq software.[2]
  • A computer capable of running the free jAmaSeis software, which can record, display, archive, and analyse seismic data.[3]
Recording system: 1) A/D conversion and digital filtering 2) Computer running jAmaSeis
Image courtesy of Vasilis (Bill) Nousis

Activity 1: Clarifying the operation of the ground-motion detector

The mechanical vibrations of the mass–spring system are converted into an electrical signal based on the electromagnetic induction phenomenon. The principle of operation is demonstrated in this activity. It should take around 5 mins.

Materials

  • a multi-turn coil
  • an ultra-bright light-emitting diode (LED)
  • some strong neodymium magnetic disks
  • short cables with alligator clips
components of the ground-motion detector: LED,  multi-turn coil, neodymium magnetic disks
Image courtesy of Vasilis (Bill) Nousis

Procedure

  1. Connect the LED to the ends of the coil.
  2. Insert the magnetic disks into the air core of the coil and move quickly the system up and down. During the motion the LED flashes as the mechanical energy is converted to electric.

The operation of the electromagnetic braking system is also based on electromagnetic induction.[4] The mechanical energy of a magnet moving near an aluminium plate is quickly dissipated in the form of heat due to eddy currents induced on the aluminium plate. This can be demonstrated using a pendulum with a cylindrical bob and a neodymium magnetic disk attached to the base. If you let the pendulum vibrate, its motion continues for a long time, but is minimized rapidly if you place a small aluminium plate at a short distance beneath the cylinder.

Activity 2: Mass–spring natural-frequency adjustment

As seismic waves travel through the Earth, the energy they carry is absorbed by crustal rocks. Absorption is frequency-dependent: the higher the frequency of seismic waves, the faster the energy they carry weakens with distance. Therefore, only low-frequency seismic waves from distant earthquakes can reach and excite the seismometer. So, for a seismometer to be able to detect distant earthquakes, the natural frequency of its mass–spring system must be adjusted to a value around 1 Hz. The ways in which this frequency adjustment can be implemented during the construction of a seismometer is the subject of this activity. It should take no more than 20 mins.

Materials

  • a slinky spring
  • a mass consisting of two strong neodymium magnets and three bolts to attach the magnets to the spring, as shown in the accompanying photograph
  • the provided instruction booklet for the construction and adjustment of a simple yet sensitive school seismometer.

Procedure

  1. In its simplest form,[5] the mass–spring system of a school seismometer consists of two magnets (the lower one is a mechanical-motion to electrical-signal converter and the other is the electromagnetic braking system) that are held a distance apart by one bolt. Two more bolts screwed into a small plastic tube are used to suspend the magnets from the spring.
  2. To find its natural frequency, suspend the mass–spring system to allow it to vibrate in the vertical direction and measure the time (Δt) needed for ten (N=10) complete oscillations. Calculate the frequency from the equation f = Nt
  3. Try to change the natural frequency by adjusting
    • the mass, by attaching, for example, one more magnetic disk to the system;
    • the spring constant, by increasing or reducing the number of coils that affect the motion of the mass.
  4. Try to find the best combination of these two methods to adjust the natural frequency of the mass–spring system to a value around 1 Hz.
mass spring of the school seismometer. Neodymium magnets are attached to a slinky spring by some bolts
Image courtesy of Vasilis (Bill) Nousis

See the provided instruction booklet for full assembly instructions for the seismometer. This can be done with the students as part of a science project or can be completed by the teacher or technician to provide an instrument for students to explore in class.

A simpler, albeit less sensitive, seismometer (TC-1 model[6]) can be built based on instructions that can be found online or even purchased as a kit.

Activity 3: Analysis of seismic data

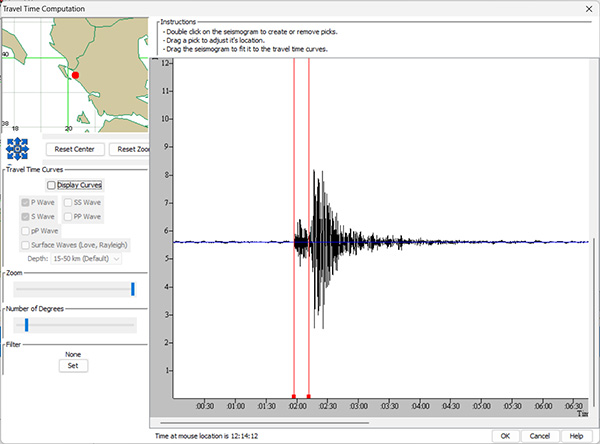
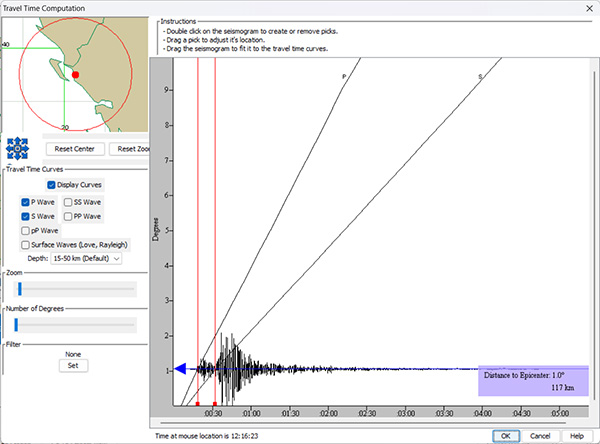
To take full advantage of the educational benefits, the involvement of students in the construction of a seismograph is a key step of the project. However, analysis of recorded seismic data can be carried out even if the students have not built a seismometer by themselves.

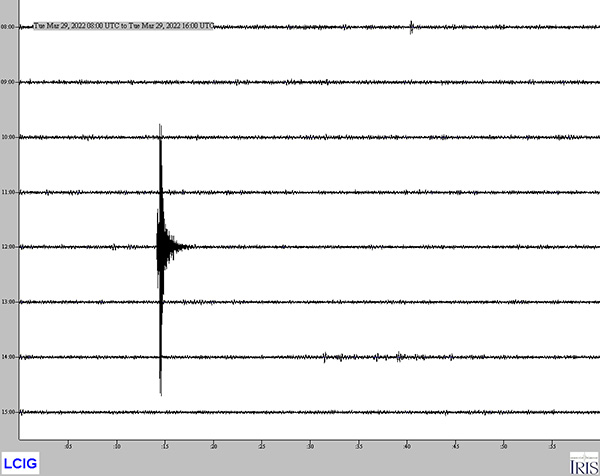
In this activity, students will analyse seismic data and calculate the distance to the epicentre of an earthquake. The free jAmaSeis[3] software has the ability to receive and display seismic data not only from local stations, but also from a list of online school and professional seismic stations. Digitally stored seismic data can also be used. The main window of jAmaSeis is the Stream View, which emulates a seismogram from a classic drum recorder. A screenshot of a seismogram from 29 March 2022 is shown in the next image. It shows the seismic data of an earthquake that occurred in Western Greece, as captured by the LCIG seismometer installed at the Laboratory Center of Physical Sciences of Igoumenitsa (coordinates: 39.5°Ν, 20.27°Ε).

Screenshot from the jAmaSeis software

 Using jAmaSeis software, students can

  • find the arrival time of the P and S waves at the seismometer;
  • determine the distance to the epicentre of the earthquake;
  • calculate the average speed of the P and S waves.

Materials

  • seismic data files in SAC format (a dataset to use is provided in the additional material)
  • the jAmaSeis software

Procedure

  1. Download the ‘LCIG-29-3-2022.sac’ seismic data file from the additional material, run the jAmaSeis software
  2. Open the Event View window, and click on the ‘Add station’ button to load the seismic data file for the 29 March 2022 earthquake.
  3. Click on the ‘Compute distance’ button to open the ‘Travel time computation’ window. Set the zoom to maximum and double click on the seismogram to display a red pick line. Drag the line to place it at the time location identifying the arrival time of the P waves. Double click again to display a second pick line, and drag it to the time location identifying the arrival time of the S waves. In general, this location is where the next maximum in the seismic data starts to occur.
Screenshot from jAmaSeis software
  • By placing the cursor over any of the pick lines, the software returns the corresponding time. Record the arrival times of the P waves (tp) and S waves (ts).
  • Check the box ‘Display curves’, and leave only the P- and S-wave travel-time curves visible. A travel-time curve is the graph of the time needed for seismic waves to travel from the epicentre of an earthquake to seismic stations at varying distances away. Determining the distance to the epicentre is as simple as dragging the seismogram to fit it to the P- and S-wave travel-time curves. Record the distance (in km) to the epicentre from the LCIG seismometer.
Screenshot from jAmaSeis software
  • When the calculation is completed, the software plots a red circle around the seismic station with a radius equal to the calculated distance. This means that the epicentre can be anywhere within the perimeter of this circle. To calculate the exact position of the epicentre, you need to apply a triangulation method by analysing seismic data for the same earthquake from three different seismic stations.
  • The Seismology Lab of the University of Athens[5] gives the exact time when the earthquake occurred: 12:53:13 (UTC). Given this result, calculate (in seconds) the times, Δtp and Δts, needed for the P and S waves to arrive at the LCIG station. Then, using the computed distance of the epicentre, calculate the average speeds of the P and S waves.

Conclusion

A school project concerning the construction of a seismometer has significant educational benefits during its construction and adjustment and later in using it to analyse seismic data. Teachers can find inspiration to teach students about aspects of electromagnetism, oscillations, geology, and even technology.


References

[1] Instructions for building and a description of a seismometer amplifier: https://www.instructables.com/DIY-Seismometer/

[2] The NERDaq software: http://ru.auckland.ac.nz/files/2014/07/nerdaqII.zip

[3] The IRIS jAmaSeis software and manual: https://www.iris.edu/hq/Wiki/jAmaSeis_Manual

[4] Hawkes R et al. (2019) Physics for Scientists and Engineers, An Interactive Approach 2nd edition. Nelson Canada. ISBN: 0176587195.

[5] Instructions for building and a description of a TC-1 school seismometer: https://tc1seismometer.wordpress.com/

[6] Earthquake catalogue search function from the University of Athens, Seismological Lab: http://www.geophysics.geol.uoa.gr/stations/gmapv3_db/index.php

Resources

Author(s)

Vasilis Nousis has a BSc in physics and an MSc in new technologies and research in teaching of natural sciences from the University of Ioannina, Greece. He is currently a natural sciences teacher in secondary education, and since 2011 has served as head of the Laboratory Centers of Natural Sciences of Igoumenitsa.

Review

I love the idea of building a cheap, affordable, simple seismometer that could be built with ease for the teaching of waves in this context.  Science is always better if explained with practical and even better if a build is involved. This enables students to investigate, calculate and look at this topic in depth.

This activity would make a nice science club project or a practical for higher-level or higher-ability physics students to build and test.  It could be used as a science fair project. It would make a really nice cross curricular project for Science, geography and technology/engineering sciences.

Mike Sands, Freelance tutor and science advisor, UK

License

CC-BY
Text released under the Creative Commons CC-BY license. Images and supporting material: please see individual descriptions.