Supporting materials
Download
Download this article as a PDF

Industrial activities and even geological changes can affect the quality of water, causing contamination that poses risks to human health and the environment. Learn how to become an independent analyst to ensure that we have good-quality water.
Industrial activities and even geological changes can be very detrimental to the quality of water, contaminating it with fertilisers, pesticides, metal ions or organic compounds that can pose a risk to human health and the environment. It is therefore crucial to constantly monitor the quality of fresh- water sources such as rivers.
Quality analysts are a key part of the process to keep us safe from polluted water. They regularly check water quality by performing quantitative analyses (such as determining the amount of an ion in a solution) on collected samples at various sites before, during and after water treatment.
In the following activity, students put themselves in the shoes of a water-quality analyst working next to a manufacturing plant similar to the Tata Steel site in Scunthorpe, UK. They will have to react to a specific scenario, perform the appropriate analyses, and determine whether the plant is removing thiocyanate from its waste water efficiently.
Thiocyanate ions (SCN–) are toxic to aquatic organisms and are known to affect the thyroid gland in humans, reducing the ability of the gland to produce the hormones necessary for the normal function of the body.
Thiocyanates can have many different origins. Coal gasification and the production of industrially useful chemicals from coal, for example, produce large quantities of thiocyanate ions, together with a large number of other toxic compounds such as phenols and ammonium. These by-products are therefore constituents of the plant’s waste water.
Thiocyanates can also be found where cyanide is used in the mining of precious metals. The cyanide is converted to thiocyanate by the reaction with sulfur, which is naturally found in ores:
8CN– + S8 → 8SCN–
Some pesticides also contain thiocyanate ions as their active, poisonous, compound. Traces of thiocyanate are found naturally in the human body as a by-product of the metabolism of cysteine and detoxification of cyanide – it is then excreted in the urine. It can be taken into the human body through smoking and is a by-product of the metabolism of some drugs used to treat hypertension.
The process of removing thiocyanate ions from waste water takes place in huge open-air concrete tanks that contain activated sludge, a biologically active material comprising a range of micro-organisms that can break down thiocyanate ions and other contaminants into less dangerous compounds. The chemical reaction that takes place to neutralise thiocyanate is:
SCN– + 3H2O + 2O2 → HCO3– + NH4+ SO42- + H+
This reaction is an example of bioremediationw1, a process in which microbes are used to clean up contaminated soil and groundwater. Plants may also be used to clean up contaminated land, in a process called phytoremediationw2.
Before and after treatment, water can easily be tested for the presence of thiocyanate ions. If the solution turns blood red upon the addition of iron(III) chloride, then thiocyanate ions are present, as per this equation:

Fe3+(aq) + SCN–(aq) → [FeSCN]2+(aq)
or, more fully,
[Fe(H2O)6]3+(aq) + SCN–(aq) → [Fe(H2O)5SCN]2+(aq) + H2O(l)
This reaction can be used for the quantitative analysis of low concentrations of thiocyanate ions. By using a colorimeter, you can measure the absorbance at 480 nm of the [Fe(H2O)5SCN]2+ complex and deduce the precise concentration of thiocyanate ions, provided it is not too high. You can also use simple colour matching, although the results will be less precise and only qualitative.
As explained in worksheet 1w3, the students should place themselves in the role of a quality analyst from a small independent quality control firm that checks results to ensure that they meet the requirements of the UK Environment Agency.

The effluent of an industrial plant such as the Tata Steel site in Scunthorpe is known to contain around 250 mg/dm3 (250 ppm) of thiocyanate ions. However, the safe level given by the UK Environment Agency is 10 mg/dm3, so the effluent is treated and the thiocyanate concentration is reduced to 1 mg/dm3, well below safe limits. The thiocyanate ions are removed from the effluent before it is fed into the River Trent.
There has been a recent period of severe cold weather, which can affect the activity of micro-organisms. The company is concerned that this has affected its water treatment plant and has reduced its effectiveness at removing thiocyanate ions from waste water.
The water is normally analysed for thiocyanate at the plant three times a day using a simple test: an acidic solution of iron(III) chloride is added to the water sample and the concentration of thiocyanate is measured photometrically by measuring the absorbance due to the iron(III) thiocyanate complex. A total of 16 separate tests are carried out every week. Samples of incoming effluent and the water ready for discharge into the river are also taken back for accurate analysis.
The company’s analysts have checked, but the company is seeking an independent analyst: you!
You should wear suitable eye and hand protection to handle acids and thiocyanates. You can check the safety guidelines on the Science in School website.
The following activity is aimed at students aged 16–18 and takes about 2 hours.
1. Make the following solutions in advance of the practical activity:
a– Solution of potassium thiocyanate (KSCN) at 250 mg/dm3 (250 ppm). Dissolve 4.5 g potassium thiocyanate in 500 cm3 of distilled water. Then dilute 50 cm3 of this solution to 1dm3: it is now at a concentration of 250 mg/dm3 of thiocyanate ions.
b– Solution of acidic iron(III) chloride (FeCl3(H2O)6) at 0.41 mol/dm3. Dissolve 50 g of FeCl3(H2O)6 in about 250 cm3 of a solution of hydrochloric acid (HCl) at 1 mol/dm3
c– Twelve labelled samples of different concentrations of thiocyanate ions:
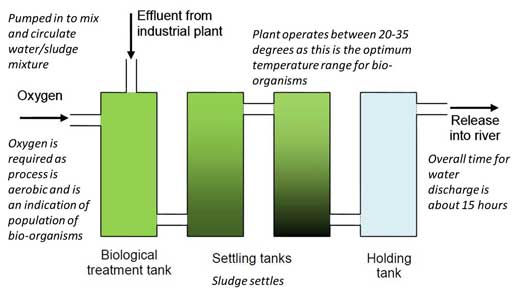
2. Provide the students with a plan of the plant (figure 1), worksheet 1w3 outlining the scenario, and worksheet 2w4 describing all the details about the analysis process.
3. The students should write a letter to the company that operates the waste water treatment plant requesting samples for analysis. They should specify at what point in the flow of effluent through the plant they would like samples to be taken, how many samples they require and when they should be taken. They should also specify the quantity of each sample needed, how they should be taken and what kind of container they should be collected with.
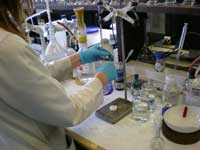
4. The students should work in pairs to analyse their samples according to the method described in worksheet 2w4.
Care: Wear eye protection: the solution of iron(III) chloride is an irritant.
1. Create a calibration graph
a. Fill three burettes, one with 250 mg/dm3 potassium thiocyanate solution for the thiocyanate ions, one with distilled water, and one with the iron(III) chloride solution.
b. To six 100 cm3 volumetric flasks, add 0.0, 2.0, 4.0, 6.0, 8.0 and 10.0 cm3 of the solution of 250 mg/dm3 potassium thiocyanate and label them A to F.
c. Add distilled water to each flask to bring the volume up to about 80 cm3.
d. To each flask, add 10 cm3 of the iron(III) chloride solution and then add distilled water to bring the volume up to 100 cm3. Mix the solutions thoroughly.
| Flask | a | b | c | d | e | f |
|---|---|---|---|---|---|---|
| Volume of potassium thiocyanate solution (cm3) | 0.0 | 2.0 | 4.0 | 6.0 | 8.0 | 10 |
| Concentration of thiocyanate (ppm) | 0 | 5 | 10 | 15 | 20 | 25 |
e. Measure the absorbance of each solution using a colorimeter.
f. Plot a graph of absorbance (y axis) against the concentration of thiocyanate ions in ppm (x axis) for the six solutions.
2. Analyse the sample
a. Add 10 cm3 of the solution of unknown thiocyanate concentration to a 100 cm3 volumetric flask and add distilled water to bring the volume in the flask up to about 80 cm3.
b. Add 10 cm3 iron(III) chloride solution to the flask and then add distilled water to bring the volume up to 100 cm3. Mix the solution thoroughly.
c. Measure the absorbance of the solution using a colorimeter.
d. Use the graph to find the concentration
3. Write a report to the waste water treatment company summarising your findings, including a recommendation about whether the effluent should be fed into the river or not. Students should describe the evidence on which their recommendation is based and comment on their confidence in the results, taking into account any percent error that may be involved in their analytic procedures.
Educational research has shown the value of placing theoretical ideas in ‘live’ project scenarios – or in real-world contexts. This practical activity is a good example of placing classical analytical chemistry in a real-world context. It also offers the opportunity to develop transferable skills in data processing and communication.
Marie Walsh, Limerick Institute of Technology, Ireland
Download this article as a PDF