Supporting materials
Instructions for building your own seismograph (Word document)
Instructions for building your own seismograph (PDF file)
Download
Download this article as a PDF


Did you know that you can use old hi-fi speakers to detect earthquakes? And also carry out some simple earthquake experiments in the classroom? Here’s how.

Earthquakes occur around the world all the time. In 2011, the earthquakes that caused the Fukushima disaster in Japan, killed thousands in Turkey and devastated Christchurch, New Zealand, made the headlines. But did you know that 2011 also saw earthquakes in Finland, Belgium and the Czech Republic?
Some earthquakes may be so slight as to be practically unnoticeable, but they can still be recorded. Each tremor produces different types of vibration, or seismic waves, which travel through Earth’s interior with different velocities. These waves can be detected and recorded by instruments called seismographs, which are often sited at great distances from the earthquake. By measuring the time that the seismic waves take to arrive at seismographs, as well as recording the amplitude and duration of the waves, we can calculate the magnitude of the earthquake and determine its epicentre.
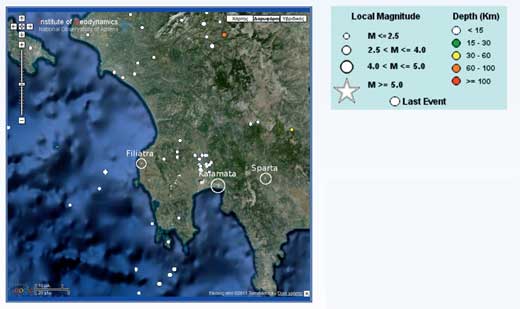
Earthquakes are a daily occurrence in Greece (figure 1), sitting as it does at the boundary of two tectonic plates. The district of Messinia, where our school is located, has a history of major earthquakes. In 1886, a severe earthquake of magnitude 7.5 on the Richter scale struck Filiatraw1 (figure 2). A century later, Kalamata was hit by another strong earthquakew2, this time of magnitude 6.0. Within the next 100 years, it is predicted that Sparta will be struck by an earthquakew3 of at least magnitude 7.0.


To encourage my students to learn about earthquakes, I acquired and set up a commercial, educational seismograph in our school (figures 3 and 4), the General Lyceum of Filiatra. The seismograph is based on an array of three geophones – devices that respond to the seismic waves and convert them to electrical signals. Each of the three geophones monitors waves in the up-down, east-west or north-south directions. The three signals are then processed by computer, allowing the magnitude of the earthquake and the distance from the epicentre to be calculated (figure 3).


I also wanted to encourage the students to think about the technology that is used to detect and measure earthquakes and to understand what each component does, rather than viewing a seismograph as a ‘black box’. To this end, we build our own seismograph, with which we can detect local earthquakes – up to 100-200 km away, depending on their magnitude.
At the heart of any seismograph are the geophones. They convert the ground vibrations into electrical signals using a coil that moves relative to a magnet, producing an electrical voltage at the end of the coil (Faraday’s law; figure 4). To build our seismograph, we used everyday technology as the geophone: a loudspeaker. Normally, loudspeakers operate by converting an electrical signal into the relative movement of a coil and a magnet, which causes the cone to move in and out, thus generating vibrations: sound waves (figure 5). By making them operate the other way round – turning vibrations into electrical signals – they can be made to function as geophones.

To make our geophone, we used a ‘woofer’ – a speaker for low-pitched sounds – because woofers are designed to work well for low frequencies, and seismic waves are of course low-frequency vibrations. To minimise interference from sound vibrations, we removed the cone of the loudspeaker.

To complete our geophone (figure 6), we also used a weight, a spring and the lid of a spray can. The weight serves to increase the inertia, as the loudspeaker coil itself is very light. Placing a weight directly onto the coil would damage it, so we used the spring to hold the weight over the coil, allowing it to oscillate. The lid protected the coil. We then plugged our woofer geophone into the sound-card port of a computer, and recorded the signals using sound-editing software, creating a working seismograph.
Detailed instructions for building our seismograph can be downloaded from the Science in School websitew6.
If you are interested in monitoring and investigating seismic activity in the classroom, you could:
To record earthquakes with either a commercial or a homemade seismograph, you will need to be relatively close to their epicentres. Our homemade seismograph detected earthquakes up to 100-200 km awayw9, depending on magnitude. With our commercial seismographw10, we detected earthquakes of 4.0 on the Richter scale from 500 km away.
Options 1 and 4 have the advantage of being feasible even in regions with very little seismic activity.

The coil of the homemade seismograph is very sensitive, so the geophone must be handled with great care. For the best measurements, set up the seismograph somewhere quiet and free from vibrations, perhaps in the school cellar. However, to encourage student participation, I set mine up in the classroom.
Once you have set up your seismograph, let it record continuously for one or two days, then save the data in a file. Before you can search for earthquakes in the data, you will need to do some processing. The exact details of the processing will depend on the software you use, but it should be fairly straightforward.
Not all signals recorded by seismographs are earthquakes. Other, more local sources, including traffic, wind, explosions and opening and closing doors, can cause confusion. Earthquakes often have a characteristic pattern: a small waveform followed by a large one (see figure 3). Because this is not always the case, however, you and your students may sometimes be unsure if what you have detected really is an earthquake. The only way to be certain is to do what professional seismologists do and compare your data with the recordings made at other seismographic stationsw7,w8.
When you are confident that you have detected an earthquake, you can calculate its magnitude (on the Richter scale) and your distance (in km) from the epicentre (figure 7). For that, you need only three measurements: the arrival time (in seconds) of the P and S waves, and the time at which the vibrations stop (see figure 3). For more details, download the instructions from the Science in School websitew6.


I also devised some experiments to simulate some aspects of earthquakes and the signals they produce – for example, how the energy of the earthquake decreases as it passes through different materials.
To do this, we used speakers and a computer equipped with a sound card and audio processing software, as before. But in place of geophones you can use old computer speakers (again with the cone removed), which can be moved around as needed in the experiments (figure 8). You can use 100W / 8Ω woofers, as in the construction of our seismograph, or 3W / 8Ω computer speakers, plus the sound-editing software Audacityw11. For more details, see steps 1, 8 and 9 in the downloadable instructionsw6.
The experiments involved dropping balls from different heights (representing different energies) at different distances from the detectors (the speakers), onto surfaces made from various solid materials.
When the ball strikes the hard surface, it produces vibrations that travel through the solid – just as an earthquake produces waves that travel through Earth.
This activity demonstrates the relationship between earthquake power and ground movement. We caused vibrations on a piece of marble (or wood, plastic or even the ground) by dropping a mouse ball (from a computer mouse) from different heights, producing different ground-shaking powers. The amplitude of the signal depends on the power of the shake.


| Height (cm) | 10 | 15 | 20 | 25 | 30 |
|---|---|---|---|---|---|
| Signal amplitude |
This activity demonstrates the energy attenuation (decrease) as seismic waves travel through Earth’s crust. We produced vibrations by dropping a 4 kg shot put (metal ball) on the ground from the same height but at different distances from the woofer geophone or loudspeaker. As the waves travel, they lose energy and the ground vibrates less. This is reflected in the amplitude of the signals.

| Distance from geophone (m) | 1 | 2 | 3 | 4 | 5 |
|---|---|---|---|---|---|
| Signal amplitude |
In this activity, we investigate wave velocities in different media. As seismic waves travel through Earth, their velocity differs depending on the composition of the rocks they are travelling through. This gives seismologists and geologists important information about Earth’s interior. Here, we investigate how fast vibrations travel through different solid materials.
We used wood, iron and marble as the materials, but any hard solid can be used. Just make sure you have the various materials available in a size suitable for the activity.
| Material | t1 | t2 | t2-t1 | x | v = x / (t2-t1) |
|---|---|---|---|---|---|
| Wood | |||||
| Iron | |||||
| Marble |
In 2011, an earthquake caused an environmental disaster by damaging the nuclear power plants in Fukushima, Japan. This article briefly describes the mechanism of earthquakes and especially the propagation of the different waves running through Earth. These waves can be measured with seismographs.
The author describes how you and your students can build your own seismograph using an adapted loudspeaker and audio software. This would be an interesting project in physics (acoustics, acoustic-converter, induction, the mechanical properties of springs), earth science (earthquakes and their classification), biology or electrical engineering (practical work) lessons. It could also be used in IT lessons (analysing the audio signal and how audio software works; using database software to build a earthquake database).
If you have too little seismic activity in your region to make it worth building your own seismograph, you could visit the suggested websites to download earthquake data to analyse with your students. And of course you could still carry out the earthquake-simulation experiments that the author describes.
The article stimulates questions like:
Gerd Vogt, Higher Secondary School for Environment and Economics, Yspertal, Austria