Shaken by the (pressure) waves Understand article
A pressure wave generated by the explosion of a volcano 18 000 km away was detected as an unexpected windfall of a school ambient air monitoring network.
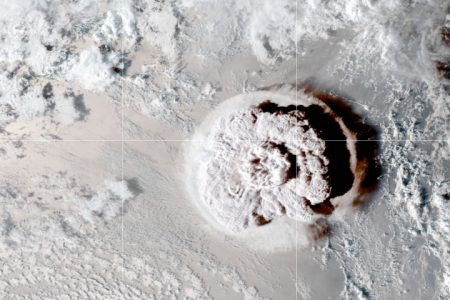
Image: NASA/NOAA/AFP
On 15 January 2022, a gigantic explosion occurred at the Hunga Tonga-Hunga Ha’apai submarine volcano in the South Pacific, near the island of Tonga, some 18 000 km from Spain. The Earth’s entire atmosphere began to vibrate like the surface of a pond when a stone is thrown at it.[1]

Gif: Mathew Barlow, Dept. of Environmental, Earth and Atmospheric Sciences. UMass, Lowell
Then, at 11:31 CET on Monday 17 January, sensors at the Centre for School Exchanges in Madrid registered a small, unusual increase in atmospheric pressure, visible as a peak on the plot (figure 1).[2] One minute later, a similar peak appeared in data from a location 20 km south of the first. When another bump showed at 13:07 in our pressure readings at the Spanish island of La Palma, 1800 km away, we knew that we had detected a pressure wave from the explosion travelling around the Earth at about 1100 km/h.[3]
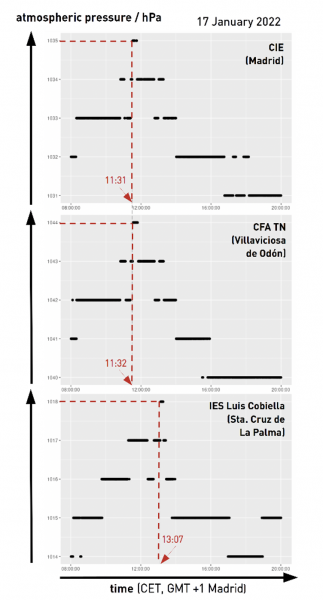
Image courtesy of Francisco Barradas-Solas
Waves in the atmosphere
The Earth’s atmosphere is a fluid that can vibrate in many ways. Locally, it supports the sound waves that we hear, but it can also carry atmospheric waves that range from metres to thousands of kilometres in width and depth and transport huge amounts of energy. These waves affect the atmosphere at all scales, so their understanding is relevant from local meteorological forecasting and the prediction of extreme weather events to the study of global climate change.[4]
Pressure waves: from local to global
Sound is the best-known example of a pressure wave: mechanical vibrations push air molecules which oscillate back and forth and in turn push neighbouring molecules and so on… The resulting wave is referred to as “longitudinal” because the wave and its energy propagate in the direction of molecule displacement.
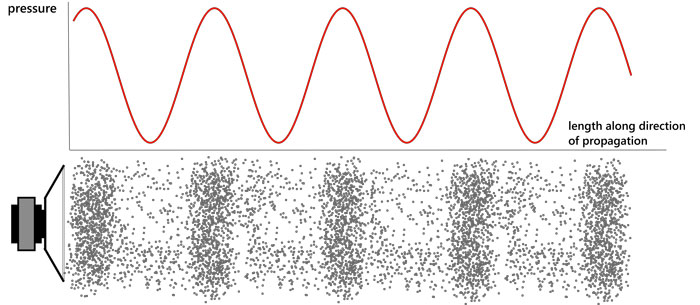
Image courtesy of Francisco Barradas-Solas based on work by Pluke/Wikimedia, Public Domain
In addition to these everyday pressure waves, a study from 2020 indicates that there are also continent-sized areas of high and low pressure covering the surface of the Earth in a checkerboard style and moving at speeds of more than 1100 km/h.[5,6] These are thin layers of the atmosphere close to the ground that vibrate like a bell when it is struck. These “normal modes of vibration” – of still-unknown origin – can be used to test global climate models.
There is yet another type of global pressure wave that was first seen in 1883, when the Mount Krakatoa volcano exploded and sent ripples of surface atmospheric pressure around the Earth.[7] These sound waves circled the Earth at least three times, propagating concentrically from the explosion. See the Resources at the end of this article for more information on this phenomenon.
If you read R. H. Scott’s “Note on a series of barometrical disturbances which passed over Europe between the 27th and the 31st of August 1883”[8] you’ll notice pressure plots quite like ours in figure 2, so maybe the event we described in the introduction is of a similar type…
But who are “we”, and why were we measuring and recording the barometric pressures that led to our (re)discovery?
School citizen science and our ambient air monitoring network
Science can seem like an abstract subject with little connection to our everyday lives. However, anyone can get involved in “doing science”; this is the territory of citizen science, that is, science performed by non-professionals.
According to EU Citizen Science: “all people can participate in many stages of the scientific process, from design of the research question, to data collection and volunteer mapping, data interpretation, and analysis, and to publication and dissemination of results”. [9]
This is why we, the Centre for School Exchanges (“Centro de Intercambios Escolares de la Comunidad de Madrid”), as part of the Educational Innovation and Teacher Training service of the Madrid Regional Government, are establishing a school network of ambient air quality monitoring with which students will be able to study their immediate environments and share not only data and analysis, but also problems and proposals.
The devices we have developed carry sensors for CO2 concentration, barometric pressure, temperature and relative humidity, total volatile organic compounds (VOC), and particulate matter concentration (PM 1, PM 2.5, PM 10). They are easy to assemble, flexible, and relatively cheap. [10]
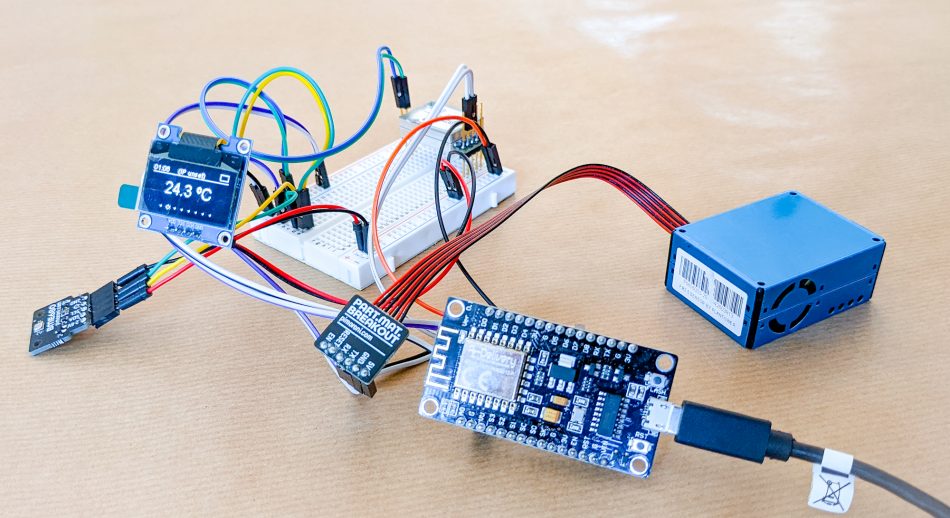
Image courtesy of Francisco Barradas-Solas
This network, which is now expanding from Spain to Europe and beyond, will be described in the next issue of Science in School, along with details on how to take part, from construction of the devices to data sharing and analysis.
And now, let’s get back to the event that our network discovered as an unexpected windfall.
The Hunga Tonga-Hunga Ha’apai explosion and its atmospheric waves
When the Hunga Tonga–Hunga Ha‘apai submarine volcano exploded on 15 January, 2022, it was the culmination of a series of eruptions and caused a disaster for the 100 000 inhabitants of the Tonga archipelago, located in the South Pacific Ocean some 3000 km east of Brisbane, Australia. It has been estimated that the eruption was the equivalent of around ten megatons of TNT, more than 500 times as powerful as the Hiroshima nuclear bomb. The blast was heard as far away as Alaska, 9000 km away, and sent a plume of ash, steam, and gas some 20 km into the air, to the upper atmosphere.[11, 12]
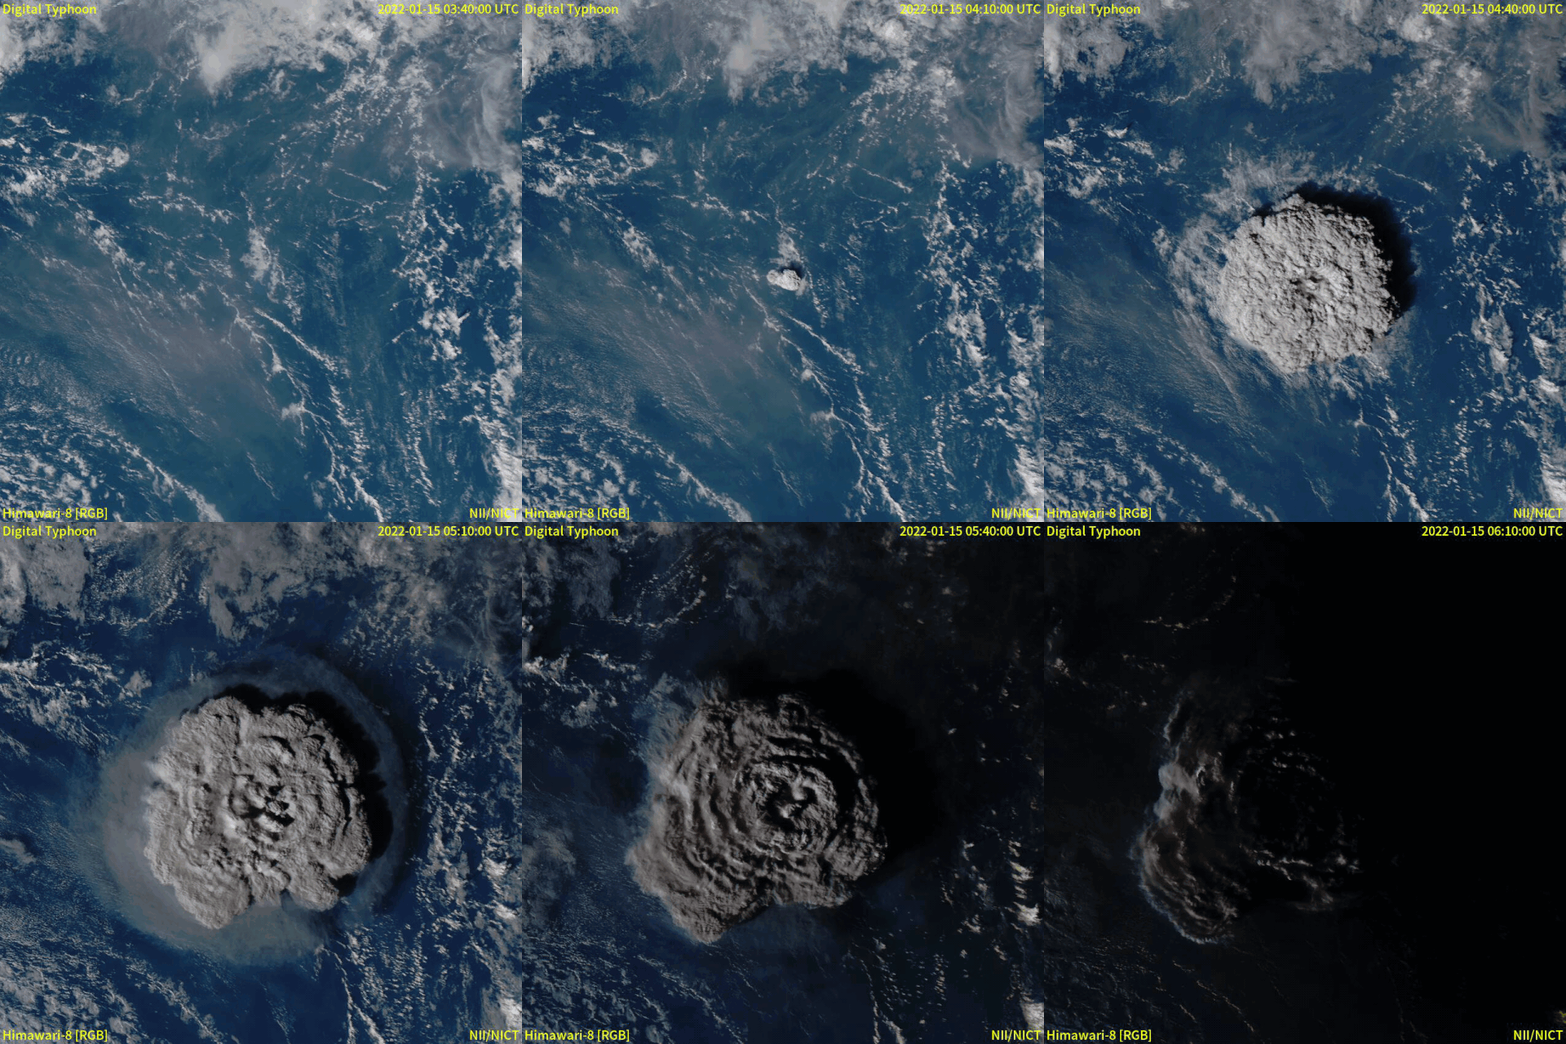
Gif: Japan Meteorological Agency, CC BY 4.0
This was not only one of the biggest volcanic eruptions since scientific records began, but perhaps one of the most unusual. [13] It is one of the rare chances that scientists have had to study water-lava interactions, which can potentially help them develop models for the geology of the surfaces of Mars and Venus. [14]
But perhaps the most bizarre feature of this explosion is the one that even non-specialists like us have been able to record (along with, probably, hundreds of amateur meteorologists all over the world): the pressure waves that circled the Earth up to ten times in one week.
These ripples resemble those generated by the Krakatoa eruption almost 140 years ago, but this time we’ve got data far beyond surface barometric pressure readings and our models of the atmosphere are way better, which makes these waves even more puzzling.[15–18] To begin with, we cannot simply speak of “the pressure wave”, as the detonation probably excited many types of waves through the atmosphere, from the surface to the ionosphere.
Fortunately, some of these waves were captured in infrared images by the GOES-West and EUMETSAT satellites. These images, available online, were stitched together by atmospheric scientist Mathew Barlow to make amazing animations of the ripples propagating concentrically from the explosion site,[1] then going into and out of the antipodal point over southern Algeria,[19] not just once but up to ten times in seven days!
The explosion knocked neighbouring air molecules and caused local pressure changes: an expansion and compression that forced air farther along the wave’s path, as in any pressure wave. Hours later, barometers around the globe began detecting small increases visible in plots of the variation in surface atmospheric pressure with time: barometers registered peaks of a few hPa (a few tenths of a percent) over the expected background values as the wave travelled at about 1100 km/h, slightly below the speed of sound. Social networks allowed us to follow the developments almost in real time, as shown by tweets from meteorological services and scientists.[20–23]
Thus, in one of the first passes of the perturbation through Spain, we detected the atmospheric pressure peaks shown in figure 1 at three stations of our school ambient air monitoring network. Comparison with sources[20–23] let us identify the peaks as being produced by the Hunga Tonga-Hunga Ha’apai submarine volcano explosion with reasonable confidence. [3] This illustrates the exciting phenomena that can be detected by these kinds of projects.
So be vigilant; have your eyes wide open, and there’s no telling what you might find out!
References
[1] An animated gif by Mathew Barlow with real infrared images from satellite GOES-West IR (band 13) data, from 4 UTC – 10:50 UTC, 15 January 2022: https://github.com/mathewbarlow/animations/blob/main/tonga_wave_labeled.gif
Please note that the comparison with the ripples in a pond doesn’t extend from the appearance to the detailed physical mechanism. More animations and details at: https://github.com/mathewbarlow/animations
[2] Original, unprocessed data set: Barradas-Solas F, Blanco-Gil R (2022). Ambient air sensor data for 2022-01-17 (1.0) [Data set]. Zenodo. doi: 10.5281/zenodo.6302018
[3] A blog post (in Spanish) about an educational game on reading meteorological observation: https://aemetblog.es/2022/01/31/sobre-la-onda-de-presion-del-volcan-hunga-tonga/
This highlights the fact that the situation is considerably more complicated than it initially appears. For instance, our estimation of the speed of the pressure wave is based on several assumptions and must be viewed critically: we may have detected not the primary wave, but a secondary one propagating perpendicularly to it with a similar speed.
[4] An article on Planetary Society about atmospheric waves: https://www.planetary.org/articles/atmospheric-waves-awareness
[5] Read a Physics World research update on how Earth’s atmosphere behaves like a bell: https://physicsworld.com/a/earths-atmosphere-rings-like-a-giant-bell-say-researchers/
[6] An article on The Atlantic about continent-size pressure waves circling the Earth: https://www.theatlantic.com/science/archive/2020/08/centuries-old-theory-finally-confirmed/615295/
[7] A report on the explosion of the Krakatoa volcano on Acoustic Today: https://acousticstoday.org/wp-content/uploads/2019/07/KRAKATOA-AND-THE-ROYAL-SOCIETY-THE-KRAKATOA-EXPLOSION-OF-1883-Thomas-B.-Gabrielson.pdf
[8] Scott RH (1883). I. Note on a series of barometrical disturbances which passed over Europe between the 27th and the 31st of August, 1883. Proceedings of the Royal Society of London 36: 139–143. doi: 10.1098/rspl.1883.0087
[9] The platform for citizen science projects and resources: https://eu-citizen.science/
[10] An unpublished presentation for the schools in the network by F. Barradas-Solas and R. Blanco-Gil: https://cloud.educa.madrid.org/index.php/s/tJGLMIxb8osBhj3
[11] The Hunga Tonga-Hunga Ha’apai Eruption in a News article and satellite video by the National Oceanic & Atmospheric Administration: https://www.nesdis.noaa.gov/news/the-hunga-tonga-hunga-haapai-eruption-multi-hazard-event
[12] An article on a the explosive force of the Tonga blast: https://www.npr.org/2022/01/18/1073800454/nasa-scientists-estimate-tonga-blast-at-10-megatons?t=1645976415336&t=1649148297117
[13] A Nature News Feature on the peculiarity of the Tongan eruption: https://www.nature.com/articles/d41586-022-00394-y
[14] A Nature News explains how the Tonga eruption can help study Mars landforms: https://www.nature.com/articles/d41586-022-00137-z
[15] An article from The Conversation about the intensity of the Tonga eruption and the atmospheric pressure waves produced: https://theconversation.com/tonga-eruption-was-so-intense-it-caused-the-atmosphere-to-ring-like-a-bell-175311
[16] Read about the surprising reach of Tonga’s giant atmospheric waves: https://eos.org/articles/the-surprising-reach-of-tongas-giant-atmospheric-waves
[17] Read about the ripples created by the Tonga volcano eruption in this Nature News article: https://www.nature.com/articles/d41586-022-00127-1
[18] Some of the effects of the underwater volcano Hunga Tonga-Hunga Ha’apai eruption: https://www.eumetsat.int/hunga-tonga-hunga-haapai_2022
[19] An animated gif by Matthew Barlow of the waves moving as captured in infrared images by the GOES-West and EUMETSAT satellites: https://github.com/mathewbarlow/animations/blob/main/tonga_eumet_labeled.gif
[20] A Tweet by The Met Office with the UK pressure trace showing the first and second pressure wave: https://twitter.com/metoffice/status/1482605906659622914
[21] A Tweet by the Agencia Estatal de Meteorología (AEMET) Valencia following the pressure pick over time: https://twitter.com/AEMET_CValencia/status/1483116571446976527?s=20&t=rXAipWctRzWyOpEsCp436A
[22] Pressure anomalies caused by the Tonga eruption as shown in a map by AEMET, the Spanish national meteorological service: https://twitter.com/AEMET_Esp/status/1488172723352133634?s=20&t=m0YAwtyjMp9i6uORI7QaiQ
[23] A Tweet by Diego Aliaga, Atmospheric Scientist, showing a map with the shock wave circling the planet, 7 times in 10 days: https://twitter.com/diegoaliaga2/status/1485469621327069185?s=20&t=m0YAwtyjMp9i6uORI7QaiQ
Resources
Atmospheric waves
- An article on Rossby ocean waves by the National Ocean Service, S. National Oceanic and Atmospheric Administration.
- Watch a video on Rossby waves and extreme weather by the Potsdam Institute for Climate Impact Research PIK.
- Read how atmospheric gravity waves can help improve weather and climate models.
Waves and sound
- An interactive piano shows the different sound waves associated with the piano keys.
- A page on the science of sound by NASA with graphs, videos and explanations.
- Longitudinal and transverse wave motion animated by Dan Russell.
Related articles from Science in School
- Find out how to build a seismograph with your class: Bazanos P (2012) Building a seismograph from scrap. Science in School 23: 25–32.
- Ideas for classroom experiments by Earth Learning Idea: King C, Devon E, Kennett P (2010) Getting down to Earth: ideas for the earth science classroom. Science in School 15: 39–43.
- Use effervescent heartburn tablets to model the action of volcanoes and measure the intensity of the explosions: Measuring the explosiveness of a volcanic eruption. Roemmele C, Smith S (2016) Science in School 37: 46–49.
Mount Krakatoa eruption
- The Wikipedia page on the 1883 eruption of Mount Krakatoa.
- A contemporary and very detailed account of the Mount Krakatoa Eruption.
Hunga Tonga-Hunga Ha‘apai eruption
- Read an article about the Tonga eruption on the NASA Earth Observatory website.
- Read how the Hunga Tonga-Hunga Ha‘apai volcano activity has caused morphological changes at the site.
- Himawari-8 satellite images of the Hunga Tonga-Hunga Haʻapai eruption.
- The shockwave from the Hunga Tonga eruption captured by GOES-17.
Citizen science and education
- Read an article on the challenges and opportunities of citizen science.


