Supporting materials
Download
Download this article as a PDF

Sweet success: everyday objects can be used to demonstrate fundamental physical principles in an engaging manner.
Practical and experimental work is a fundamental aspect of physics teaching and learning, but the complexity of practical activities can divert attention from the relationship that we wish students to focus on. Furthermore, students may get the idea that the principles explored apply only to that specialized experimental setup, rather than being a fundamental part of the world around them. Simple and easily accessible objects and equipment can be used to make physical principles more real to students. Here, some activities with relatively simple and easily accessible equipment that still generate quantitative data are presented. These examples also have the advantage that it may be possible for students to carry them out individually or in smaller groups than usual. In some cases, the data that students generate could be classified as somewhat ‘rough’, but it should be robust enough to demonstrate the key relationships and principles.
It is common to use a helical spring to show the relationship between tensile force and extension and explore Hooke’s law. In this experiment and the accompanying extension activity, this data is collected from sweet treats. Although the data from these two experiments may not be as perfectly linear as that with a helical spring, this activity helps to show that these key principles and methods apply not just to springs but to many other materials too, and this is actually the basis for standard material-testing procedures. The marshmallow experiment shows that the principles and methods apply to compression as well as tension, which is often overlooked.
Estimated time: 30 min, including graph drawing
Target age: 11–14, 14–16
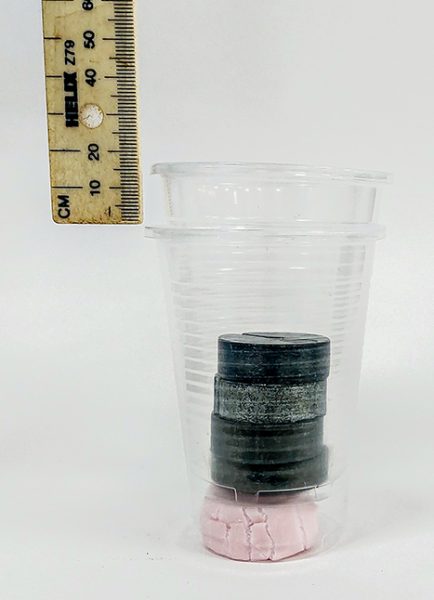
There are opportunities here to talk about materials testing and engineering applications. Alternative versions of this experiment use cushion foam or even a kitchen measuring jug on a piece of card on top of a domestic sponge. The sponge version has the advantage that it does not need specific masses, as the volume of water in a measuring jug can be used to calculate the weight (100 ml = 100 g = 1 N).
For older students, depending on the quality of the data, stress/strain data can also be calculated, from which the value of the Young’s modulus can be calculated.
As an extension activity, try exploring tension with strawberry laces instead if the classical springs.
Estimated time: 30 min, including graph drawing
Target age: 14–16
When teaching students that the universe is expanding, understandably, it can be difficult to provide much practical work, but this activity can model some behaviours of the expanding universe. Students can collect data from the model to show that, if space is expanding, further away galaxies will be moving away faster, and this will be observed from whatever point your data is measured. It is important to emphasise that, whilst this is a model, it is useful in helping us understand the behaviour of the universe. I first found about this activity from the Perimeter Institute, and it is explained in more detail in their pack entitled The Expanding Universe.[1]
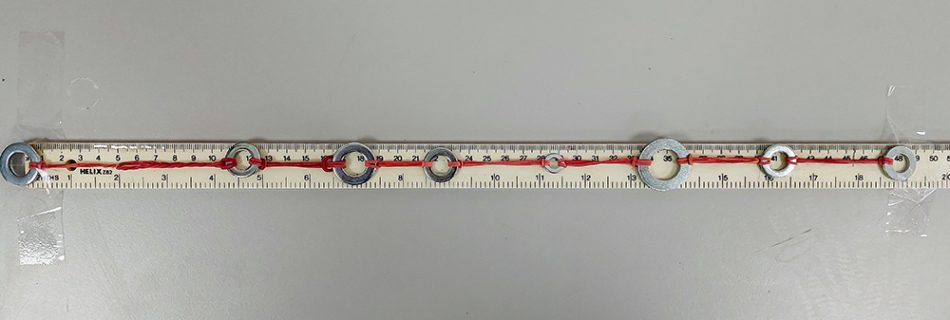
When stretched, if the elastic bands snap or are not held securely, there is some risk of students being injured and so precautions should be taken. The elastic bands do not need to be stretched significantly to generate good results and so shorter universes (fewer washers) and limited stretching is encouraged. In addition, it is suggested that the ends should be fixed down securely, so measurements are consistent and the risk of injury is minimized.
Estimated time: 30 min, including graph drawing
Target age: 14–16
The relationship between the length of a conducting wire and its resistance is important for understanding direct-current circuit behaviour. However, many classroom experiments require multiple meters, calculations, large currents, and potentially overheating wires. This version is much simpler and has the added bonus that part of the experimental apparatus becomes the graph! This activity also reinforces the idea that the relationship between length and resistance will hold true for any Ohmic conductor, not just the laboratory circuit setup. They will have almost certainly calculated resistance from potential difference and current in other experiments, but, in this case, direct measurement of resistance can help them explore a pattern more quickly.
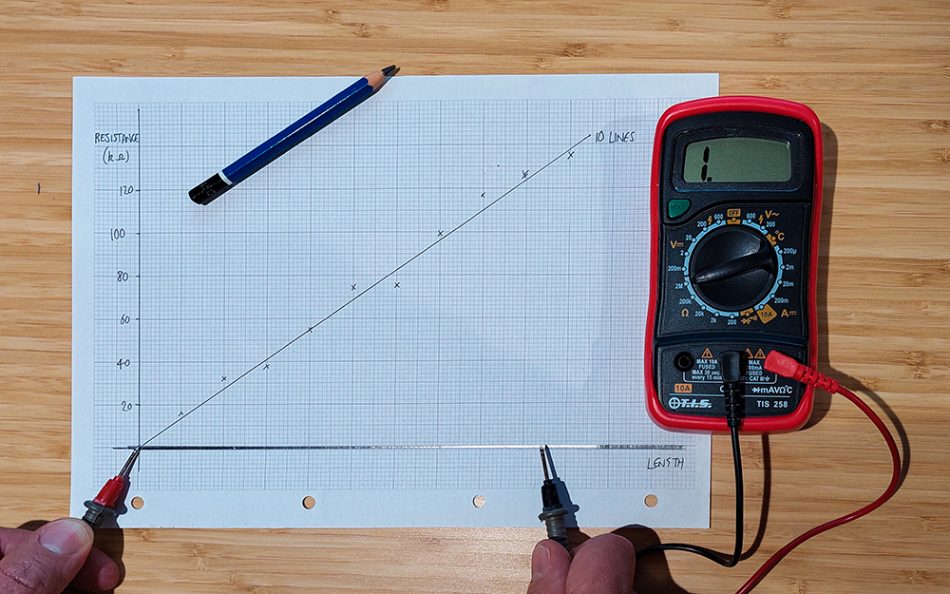
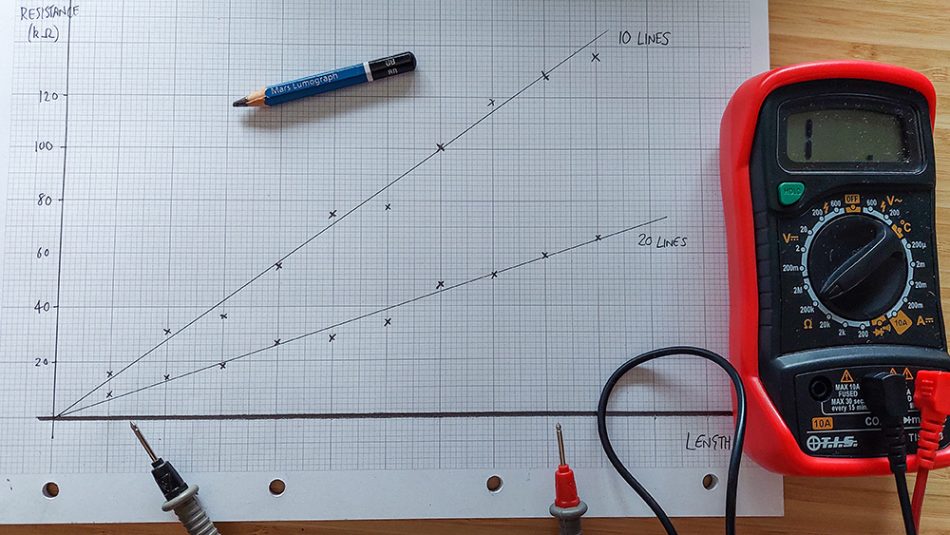
Although the data is unlikely to be perfect, students should be able to see a clear, straight-line relationship, which shows that increasing length corresponds to increasing resistance and that these are proportional.
Students can also calculate a value for resistance per unit length from the gradient of the graph. The resistance of the second, 20-pencil-line-thick wire should be approximately half that of the first one. Even if gradients are not calculated, it should be clearly seen that a thicker wire has a lower resistance for the same length.
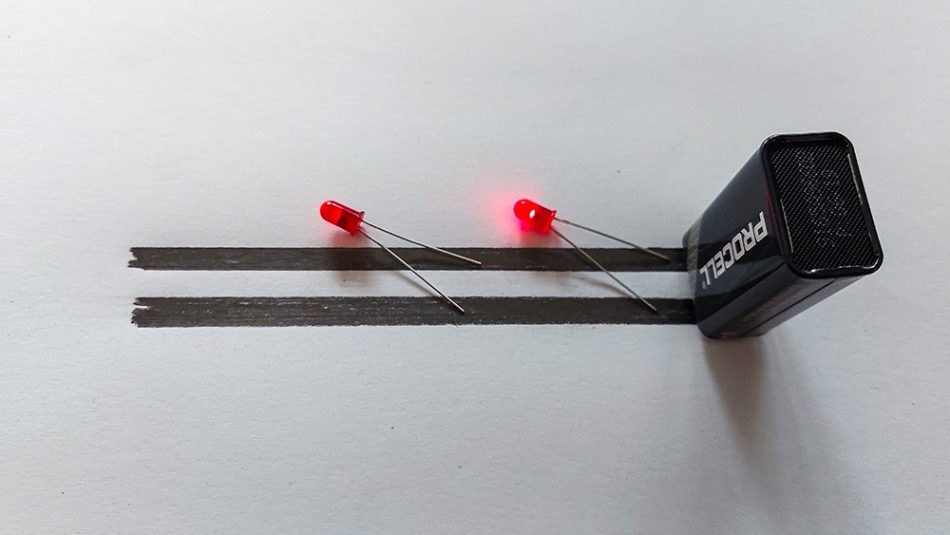
This experiment can be followed up with a simple demonstration of the principle behind some dimmer switches, using a 9 V battery and a light-emitting diode (LED). Shade two thick, parallel lines on a piece of paper; the distance between these lines should be the same as the distance between the terminals of a 9 V battery. Hold the battery terminals onto the wires at one end. Bend the legs of the LED, so that they touch the pencil wires and slowly slide the LED along the wires towards the battery. If connection is maintained and the LED is orientated correctly, the LED will be seen to get brighter as it moves towards the battery and dimmer as it moves away.
[1] A classroom activity kit from the Perimeter Institute: https://resources.perimeterinstitute.ca/products/the-expanding-universe?variant=17163100102
This is an excellent article on several fronts. It dispenses with specialist equipment in favour of household items. This helps to emphasise that science isn’t confined to laboratories and helps those students who cannot ‘see’ past sophisticated equipment to the underlying physics. Activity 1 provides an accessible alternative to the usual Hooke’s Law investigation. It shows that Hooke’s Law also applies to objects in compression and replicates how scientists actually measure the stress, strain and Young’s Modulus of materials.
Activity 2 models a one-dimensional universe, which neatly demonstrates that the universe has no centre. This could lead to a discussion of other counter-intuitive ideas in physics, the difficulties of visualising them, and the use of models to explain them. For example, it is believed that the universe has no edge or boundary. To solve this, you could get students to imagine the three-dimensions of space reduced to the two-dimensions on the surface of a sphere. No matter the journey, an edge is never encountered on this surface. There is no centre and the size of the universe would increase if the sphere were allowed to expand.
Mike Follows, Physics Teacher & Head of Junior Science, King Edward’s School in Birmingham, UK
Download this article as a PDF