Supporting materials
Tables for students (Word document)
Download
Download this article as a PDF

Bioinformatics is usually done with a powerful computer. With help from Cleopatra Kozlowski, however, you can investigate our primate ancestry – armed with nothing but a pen and paper.
As a result of recent technological advances, it is relatively quick and easy to determine a DNA or protein sequence. These sequences by themselves, of course, tell us very little: GAATCCA, for example. We need to know what those sequences mean. Which proteins are encoded by that DNA sequence; does the sequence indeed encode a protein at all? What effect does a small change in the DNA sequence have on the structure of the encoded protein? What function does that protein have in the cell? And, of course, what can our DNA sequence tell us about our evolutionary history?
These and other important biological questions can be tackled with bioinformatics: essentially, by comparing DNA or protein sequences – for example, by comparing newly discovered sequences with sequences for which we already have a lot of information (perhaps they have a similar function?) or comparing similar sequences in different species.
Bioinformatics is, of course, normally done with the aid of a powerful computer. However, it is all too easy to let a computer do all the work without understanding the underlying principles involved. For this reason, these activities are designed to be done on paper, to get the students to understand how bioinformatic analysis works.
This article includes one of a group of four activities. The two introductory activities (‘Gene finding’ and ‘Mutations’) and the concluding activity (‘Mobile DNA’) can be downloaded from the website of the EuropeanLearning Laboratory for the Life Sciences (ELLS)w1. All the tables required for students to complete this activity, together with the step-by-step procedure and answers to the comprehension questions, can be downloaded from the Science in School websitew2.
The accumulation of mutations causes DNA sequences to change over generations. The following activity demonstrates how this can be used to deduce evolutionary relationships between organisms. It takes about 90 min and requires nothing but a pen and the tables, which can be downloaded from the Science in School websitew2.
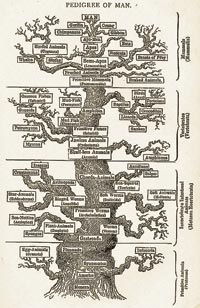
Think about how you would classify diverse animals. Traditionally, physical differences between organisms were used to deduce evolutionary relationships between them, for example, whether an organism has a backbone, or if it has wings. This may cause problems, however. For example, birds, bats and insects all have wings, but are they closely related? How do you measure how recently the organisms diverged from a common ancestor?
We know from DNA sequencing studies that DNA mutations occur randomly at a very slow rate and are passed from parents to offspring. Thus, if you assume that all organisms have a common ancestor, you can use the differences in homologous sequences to measure how long it has been since the organisms diverged. In other words, the longer the time since two species diverged from a common ancestor, the more different their DNA sequences will be.
Homologous sequences are defined as those sequences in two organisms that have a common origin. In reality we don’t really have proof that any two sequences are homologous (we were not there to watch the DNA changing over time) but if they are sufficiently similar, we often assume that they are ‘homologues’. To know how similar two sequences are, you need to align them correctly (but this is not part of this activity).
Note that different regions of the DNA – coding and non-coding regions – evolve at different speeds. In general, coding regions evolve more slowly, because a mutation that causes a change in a protein is generally more costly to the organism – it is less likely to survive and leave offspring. This is discussed in the ‘Mobile DNA’ activity.
To illustrate the concept of homology, you can use the example of philology – the study of the evolution of languages. In fact, there are many parallels between the methods used to study evolution of language and organisms.
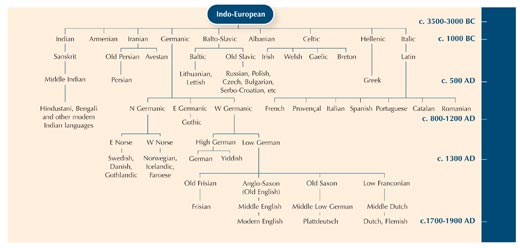
Using the differences between fragments of DNA sequences is a bit like comparing a word that means the same thing in different languages, to see how closely they are related.
| Armenian | gatz |
| Basque | katu |
| Dutch | kat |
| English | cat |
| Estonian | kass |
| Finnish | kissa |
| Icelandic | kottur |
| Italian | gatto |
| Norwegian | katt |
| Polish | kot |
| Portuguese | gato |
| Russian | kot |
| Spanish | gato |
| Swedish | katt |
You can see that the words for ‘cat’ in Italian, Spanish and Portuguese are almost the same: gatto, gato and gato. In both Swedish and Norwegian, the word is ‘katt’ but you see that in Finnish it is different: ‘kissa’. Although, like Sweden and Norway, Finland is a Nordic country, the Finnish word for ‘cat’ is more similar to the Estonian word, ‘kass’. In fact, the two languages are closely related. So you can learn a little bit about language relationships by studying how the words have changed over time.
In this activity, we will construct a phylogenetic tree using five homologous DNA sequences from primates. Because the sequences have been made up, we cannot deduce any real estimates of genetic distance; to create a meaningful phylogenetic tree from real data would require far longer sequences. Nonetheless, the fictional sequences (in Table 2) have been chosen to give a reasonably accurate picture of primate relationships.
Note: all the tables required for students to complete this activity can be downloaded from the Science in School websitew2.
| Primate | Sequence |
|---|---|
| Neanderthal (n) | TGGTCCTGCAGTCCTCTCCTGGCGCCCCGGGCGCGAGCGGTTGTCC |
| Human (h) | TGGTCCTGCTGTCCTCTCCTGGCGCCCTGGGCGCGAGCGGATGTCC |
| Chimpanzee (c) | TGATCCTGCAGTCCTCTTCTGGCGCCCTGGGCGCGTGCGGTTGTCC |
| Gorilla (g) | TGGACCTGCAGTCATCTTCTGCCCGCCCGAGCGCTTGCCGATGTCC |
| Orangutan (o) | ACAACCTGCACTCCTATTCTGCCGAGCCGGGCGCGTGGCAAAGTCC |
| Neanderthal | TGGTCCTGCAGTCCTCTCCTGGCGCCCCGGGCGCGAGCGGTTGTCC |
|---|---|
| Human | TGGTCCTGCTGTCCTCTCCTGGCGCCCTGGGCGCGAGCGGATGTCC |
| Chimpanzee | TGATCCTGCAGTCCTCTTCTGGCGCCCTGGGCGCGTGCGGTTGTCC |
|---|---|
| Gorilla | TGGACCTGCAGTCATCTTCTGCCCGCCCGAGCGCTTGCCGATGTCC |
Comparison tables for all the pairs of species, and the completed table of sequence differences (Table 4), can be downloaded from the Science in School websitew2.
| Neanderthal | Human | Chimpanzee | Gorilla | Orangutan | |
|---|---|---|---|---|---|
| Neanderthal | 0 | 3 | |||
| Human | 3 | 0 | |||
| Chimpanzee | 0 | 11 | |||
| Gorilla | 11 | 0 | |||
| Orangutan |
The number of nucleotide differences between two sequences divided by the total number of nucleotides in each sequence (in this case, 46) gives the proportional distance between the two sequences.
The ‘average sequence’ of two species is assumed to be their ancestor. In this exercise, we do not directly calculate the average sequence of, for example, Neanderthals and humans, but the evolutionary distance between the Neanderthal / human ancestor, and all other primates in the group.
| Neanderthal/ human | Chimpanzee | Gorilla | Orangutan | |
|---|---|---|---|---|
| Neanderthal/ human | 0 | (4+5)/2 = 4.5 | (11+12)/2=11.5 | |
| Chimpanzee | (4+5)/2 = 4.5 | 0 | ||
| Gorilla | (11+12)/2=11.5 | 0 | ||
| Orangutan |
Using Table 5, you can begin to construct the evolutionary tree.
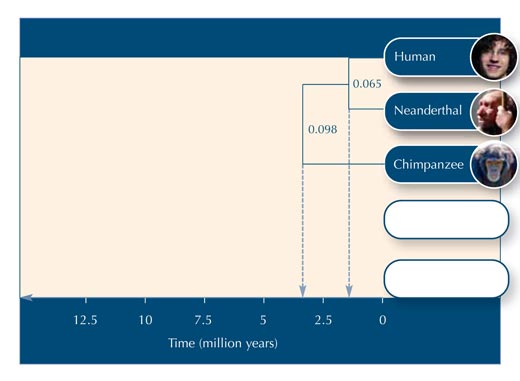
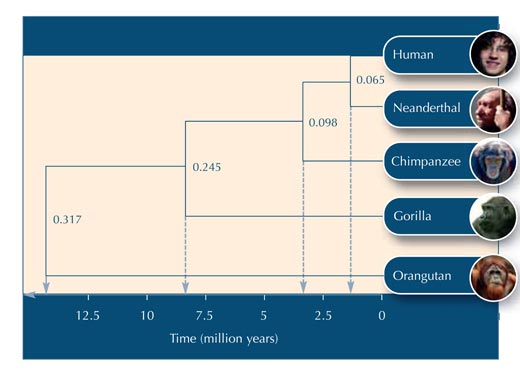
Below are some questions you could use to test your students’ understanding of the activity. Answers can be downloaded from the Science in School websitew2.
This activity was developed in a special collaboration between the European Learning Laboratory for the Life Sciences (ELLS)w1 and the European Molecular Biology Laboratory’s E-STAR Fellows to develop teaching resources for schools. Cleopatra Kozlowski was supported by an E-STAR fellowship funded by the European Commission’s Framework Programme 6 Marie Curie Host Fellowship for Early Stage Research Training, under contract number MEST-CT-2004-504640.
When we think of bioinformatics we probably imagine huge computers and sequencing machines, but the methods of this new science can be presented by means of simple classroom activities to be carried out with pencil and paper, as Cleopatra Kozlowski does in this article.
The author challenges us with the building of the family tree of humans and other primates on the basis of the genetic differences between short (fake) DNA sequences. The proposed activity can be profitably (and enjoyably) exploited in secondary schools to address some tricky biology topics such as the use of molecular clocks in the study of evolution.
The article is aimed at science teachers, who will find useful comprehension exercises at the end of the text; students can also use the questions to deepen their understanding of the topic. The quoted web references provide further information and resources.
Giulia Realdon, Italy
Tables for students (Word document)
Download this article as a PDF