Supporting materials
Instructions worksheet (Word document)
Instructions worksheet (PDF file)
Mirabilandia student workbook (Word document)
Mirabilandia student workbook (PDF file)
Download
Download this article as a PDF

Roller coasters, carousels and other amusement park rides can be great fun – and can even be used as a science lesson, as Giovanni Pezzi explains.
An amusement park or a fun fair is an ideal place for physics experiments that could never be performed in the classroom. Several projects worldwide have developed suitable teaching activities (see ‘Resources’).
One of them is ‘Mirabilandia, un’aula senza pareti’ (‘Mirabilandia, a classroom without walls’), an Italian project started in 2002 by teachers from the secondary school Liceo Torricelli in Faenza, at their local amusement park, Mirabilandiaw1. The initiative was so successful that the park’s management decided to make it available to all schools, providing educational tours by trained science students.
Maybe you could discuss a similar arrangement with your local amusement park? Meanwhile, here are some activities suitable for any amusement park or fun fair. For some, you will first need to find out about rides’ technical specifications, either from the park or online, for example at the Roller Coaster Databasew2. To take measuring instruments on board a ride, safely tied to the students’ wrists or the ride’s structure, you will need the park authorities’ consent. In our case, the school’s headmaster contacted the park management, detailing the project we had in mind.
The activities are suitable for ages 15-19, but can be adapted for younger students. They cover the topics of rectilinear and circular motion, speed and acceleration, the three laws of motion, gravity, centripetal and centrifugal forces, and energy transformation.
Students should be familiar with the basic concepts of kinematics and dynamics, and will need a basic introduction to the activities before they visit the park.
Work on each ride takes about one hour, but queuing for the ride may increase the time required. One team can perform the measurements on board, while others work on the ground. Usually there is no time for each group to repeat measurements, but data from different groups can be compared. Preliminary evaluations can be made at the park and continued back in class.
At Mirabilandia, students receive a workbook to fill in. Part of this has been translated into English and is available for download (see additional material on the right).
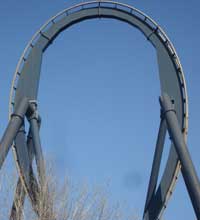
Draw a rough two-dimensional height profile of the roller coaster and discuss the energy transformations along the way, especially on the first descent and vertical loops.
At the top of the roller coaster, before the first descent, the gravitational potential energy is at its maximum; along the descent, which often has a parabolic trajectory where passengers can experience weightlessness for a few seconds (in an ideal case without friction, the vertical component of the motion increases with the constant acceleration g due to gravity as in free fall), this is transformed into kinetic energy.
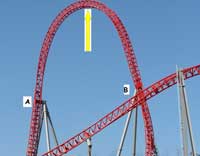
Use vertical loops to discuss the role of gravity versus centrifugal force. The loops are drop-shaped, following the course of a clothoid curve, in which the radius of curvature is in inverse proportion to the distance from the centre, thereby lowering the centripetal accelerations prevailing in the loop to make it more comfortable for the passengers.
You can only really appreciate how fast a roller coaster moves by determining its speed:
a) Calculate the instantaneous speed by dividing the length of the roller coaster train by the time it takes for the whole train to pass a specific point along the ride.
b) To obtain the average speed of the train along a section of the roller-coaster track, choose one that is easy to see and simple in terms of shape. Count the number of sleepers (regularly spaced bars between rails) on that section and subtract one to get the number of intervals. Time how long it takes for the train to travel along this section of track. To calculate the distance travelled, multiply the number of intervals by the interval length (the distance between two sleepers). Divide this by the time taken.
Compare the instantaneous speed recorded at the end of the first (fastest) descent with the speed calculated for a body in free fall: v= √(2 g h) where v: speed, g: gravity acceleration, h: height.
The measured speed should be lower, due to friction.
Pay attention to sensations of lightness or heaviness (acceleration) you may experience along certain sections of the ride. More accurate data can be obtained with spring accelerometers, or more complex handheld instrumentsw4. Instructions for how to build and / or obtain these and evaluate your results are available for download (see right).
Recently, smart phones including a three-axis accelerometer have become more popular. Applications for these phones allow you to draw graphs of acceleration over time or to measure tilt angles. These involve fewer safety issues since they can be kept inside a pocket.
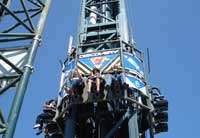
Drop towers are vertical tracks up and down which the passengers travel, seated on a gondola. In one type, the gondola is dropped in free fall; in the other, it is pushed down or up with a force greater than that of gravity.
From the ground, you can calculate the average speed of the gondola by timing its descent with a stopwatch and dividing that by the height of the tower. This can be compared to the instantaneous speed of a body in free fall. To measure the height of the tower, use a protractor and basic trigonometry or geometry. Detailed instructions are available for downloadw3.
During the ride, you can feel the acceleration in your body and measure it with portable electronic instrumentsw4.
On towers where the gondola is pushed down, the acceleration can reach up to three times that due to gravity.
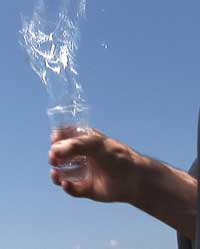
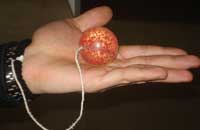
If you take a plastic cup full of water along, you can observe that in free fall, the water will remain inside the cup, but if the gondola is thrust downwards rather than falling, the water level in the cup will rise. Alternatively, you can tie a small rubber ball to your wrist (pierce the ball to attach the string) and place it on your palm.
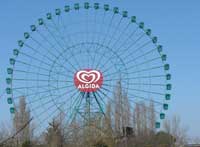
The following activities are also suitable for younger students, aged 11-14. They should be familiar with the concepts of speed and atmospheric pressure, and will learn about uniform circular motion (time, speed, frequency) and apply their knowledge about atmospheric pressure. Either on the ground or during the ride, measure and note down the time after a quarter turn, half a turn, a three-quarter turn and a complete turn of the wheel.
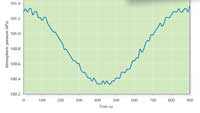
The students should find that the time taken for each quarter of a turn is similar, therefore the motion of the wheel is regular and the speed constant.
Calculate the length of the gondola’s path (from the radius of the wheel), its average speed, and, as a maths exercise applied to the real world, the angle at the centre of the wheel between two bars that connect two neighbouring gondolas to the centre (divide 360° by the number of gondolas).
You can determine the wheel’s height in the same way as that of the drop tower (see above) or by using electronic barometers to determine the change in atmospheric pressure during the ride.
Every 0.1 kPa of pressure change corresponds to about 8 m of altitude change. A more accurate description of the relationship between pressure and altitude is available onlinew5. Compare the results and discuss the advantages and disadvantages of each method (accuracy, instruments, time and effort involved).
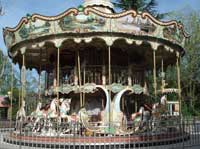
A carousel is the perfect setting to study Foucault’s pendulum and the Coriolis effect. Students should be familiar with the motion of a pendulum, the laws of motion, gravity, centripetal / centrifugal forces, and rotation. Details of how to perform these experiments are available for download (see right).
These Italian teachers have definitely found an innovative and impressive way to take physics out of the classroom. In this useful article, the activities are clearly explained, making them straightforward to reproduce. The background knowledge required for conducting the activities can easily be tackled during normal lessons; allow some time for preparing the instruments and workbooks.
The article also sheds light on safety in amusement parks, which requires careful planning. Perhaps you could to test your engineering skills by constructing your own virtual roller coaster (using www.learner.org/interactives/parkphysics) and testing it for safety. The article also links to several other useful websites.
For younger students (aged 13-16), the article could be used to address rectilinear motion; speed and acceleration; the three laws of motion; gravity; and energy transformations. Students aged 16+ could examine these topics in more detail, together with circular motion, centripetal and centrifugal forces. [Note that the author suggested carrying out the activities with 15- to 19-year-olds.]
Catherine Cutajar, Malta