Supporting materials
How does an epidemic spread on a network? (Pdf)
How does an epidemic spread on a network? (Pptx)
Download
Download this article as a PDF

Get to grips with the spread of infectious diseases with these classroom activities highlighting real-life applications of school mathematics.

Schools are breeding grounds for infections: students are constantly interacting with each other, and often they have not yet built up immunities to disease. Understanding these interactions is vital for predicting how an infectious disease – such as influenza – will spread. For school students, it is important to think about their social interactions and to understand the types of analyses that can be used to determine disease dynamics.
These cross-curricular activities are for students aged 12–15, although some may be suitable for younger or older students too. The activities can be carried out by teams varying in size from small groups to the whole class. The resources do not require anything more than the slides that can be downloaded from the additional materials sectionw1, paper and dice.
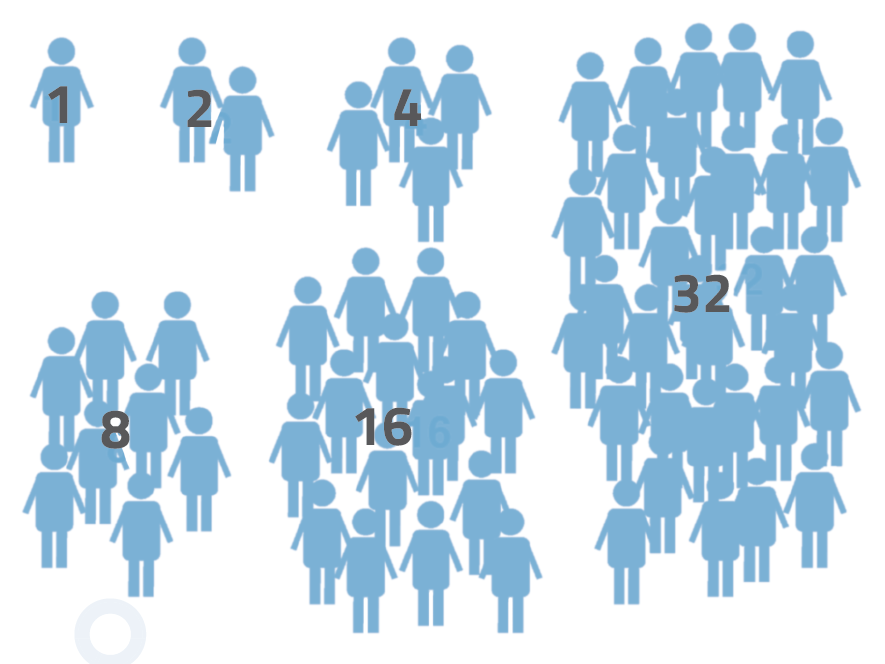
This short, whole-class activity simulates the outbreak of a disease, the symptom of which is standing up. The objective is to see how quickly the disease spreads exponentially across the classroom. With each step, the number of students that are infected doubles (see figure 1). This will help students to understand that it doesn’t take many steps for an outbreak to spread through a susceptible population.
Students will see that the rate at which a disease spreads is dependent on the number of individuals that are susceptible or infected. This is only a simple mathematical model for determining the spread of disease, however, since it assumes everyone is susceptible to infection and that exactly two individuals are infected by each person.

R0 (otherwise known as the reproduction number) is a measure used in epidemiology to indicate the average number of people that an infected person infects during the course of the contagious period (assuming that no-one in the population is immune to the disease). If R0 is greater than one, the disease will spread through the population. If R0 is less than one, the cases of the disease will decrease and the outbreak will die out.
R0 varies depending on how long the patient is contagious, the number of susceptible people in the population, and the method of transmission. Airborne diseases, such as measles, generally have a higher R0 than those spread by bodily fluids, such as Ebola.
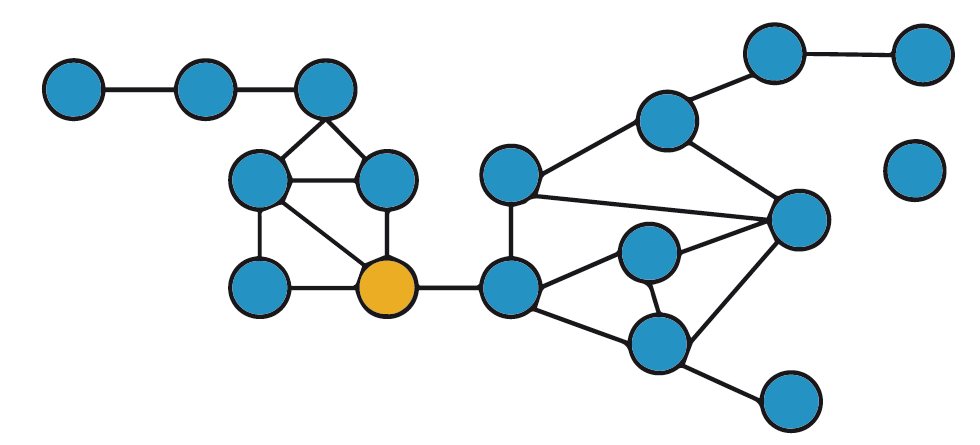
For epidemiologists, it is important to know not only the number of people that any one person may infect (R0), but also how the outbreak may spread through a population. Thus, it is vital to understand the dynamics of the community or population. This is done by looking at how individuals interact with each other: who comes into contact with whom, and how often. Mathematical modellers can then build this information into their simulations to understand how an outbreak has spread through a population. This is vital for health researchers, as it helps them to trace individuals who may have become infected. It can also suggest which patterns of social behaviour may need to be changed if an outbreak does begin, such as social distancing or quarantine.
Although Ebola has the same low R0 as flu, it quickly turned into a major outbreak in West Africa with a high mortality rate – something that would usually limit the spread of a disease because people die too quickly to infect a large group. What, then, were the major causes of the spread?
The epidemic was partly triggered by chance; the first person to be infected happened to be a traditional healer in Sierra Leone, whose funeral attracted a large crowd (Freiberger, 2015). The cultural tradition of washing the dead for burial led to increased transmission, and people who touched the infectious body took the disease with them as they travelled to other places. The outbreak was also in an area with weak health systems that were unable to enforce infection control.
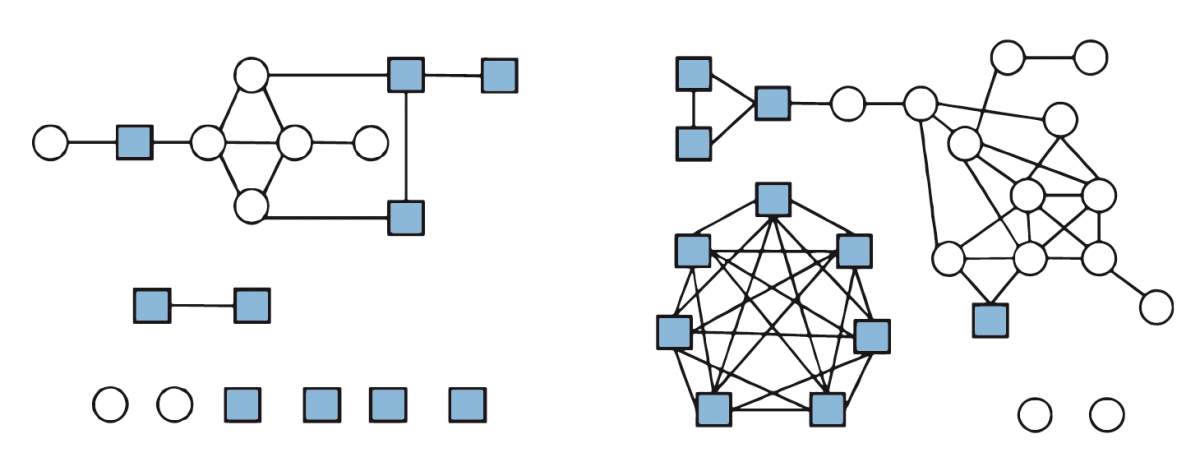
This example shows that the R0 of a pathogen can vary in different outbreaks. The spread of flu, for example, is likely to be different in a group of 4- to 5-year-olds than in a group of 10- to 11-year-olds. Figure 2 shows the interactions between individuals in these two age groups on a particular school day. In the younger age group, there are fewer interactions between multiple individuals overall, compared to the older age group, in which two larger cliques of each sex are evident. The individual nodes with no interactions indicate that a student was absent on that day.


Students can do consider these questions individually and then feed back to the whole class:
The teaching activities in this article are adapted from the NRICHw2 Disease Dynamics series. Additional activities are available in this collection, which aims to show how maths can be used to understand epidemics, social interactions and vaccination.
Modelling the spread of disease within a population requires knowledge of social contacts and the disease’s mode of transmission. This article gives students the opportunity to understand and model disease within a community such as their school and social network. It will stimulate discussion on disease transmission, tracking outbreaks of disease and how quarantine may work. The embedding of mathematics in this activity will stretch and challenge students, showing them that maths is an essential part of science and a key part of epidemiological studies.
Dr Shelley Goodman, UK